|
Research Ideas and Outcomes : Project Report
|
|
Corresponding author: Tomas Johannisson (tomas.johannisson@outlook.com)
Received: 07 Jan 2020 | Published: 13 Jan 2020
© 2020 Tomas Johannisson
This is an open access article distributed under the terms of the Creative Commons Attribution License (CC BY 4.0), which permits unrestricted use, distribution, and reproduction in any medium, provided the original author and source are credited.
Citation: Johannisson T (2020) Variation in length of alpha waves reveals how forebrain activity is organized. Research Ideas and Outcomes 6: e49942. https://doi.org/10.3897/rio.6.e49942
|
|
Abstract
Background
The cerebral cortex is composed of functional units known as columns. The “two levels” hypothesis states that the activity in a column is either at a high level or at a normal, relatively low level. Measurements indicate that the duration of the high activity in a column is around 450 ms. The number of highly active columns is often 4–5. These data are from previous studies on alpha waves in electroencephalograms. The idea is that alpha waves are created when a regulating system keeps the number of highly active columns within proper limits. If this is true, then regulating signals determines the length of the alpha waves, which opens up for a possibility to test the hypothesis.
Methods and results
Wavelengths were measured in sequences of alpha waves, and distinctive patterns in the wavelength variation were found. The elements of these patterns were repeated at intervals that exactly matched the predicted duration of high activity in individual columns.
Conclusions
The discovery of patterns in the wavelength variation confirms the central part of the two levels hypothesis. The patterns reveal the actual number of highly active columns. Moreover, the duration of high activity in a column can be measured. Number and duration outside the optimal ranges may lead to a variety of symptoms.
Keywords
wavelength, patterns, functional organization, repetitions, cerebral cortex, columns, epilepsy, mental disorders
Introduction
Alpha waves in electroencephalograms (EEGs) contain information about how the activity in the forebrain is organized. The most valuable part of this information lies hidden deep within the wavelength variation and is not easily retrieved. At first sight, the variation in the length of the alpha waves may seem overwhelming and unpredictable (
The present report describes part four of a project that started with a theoretical analysis of the functional organization of the forebrain (
A major prediction was tested in part three of the project. The hypothesis predicted that there must be three main groups of alpha waves, and an experimental study succeeded in verifying that these groups exist (
Highly specific patterns in the wavelength variation are analyzed in the fourth and final part of the project. Several examples of such patterns are given in the present paper, and they provide decisive information on the functional organization of the forebrain.
Wavelength variation and forebrain activity
To explain the variation in wavelength and its relation to the activity in the forebrain, we need to better understand the mind-brain problem (
The same building blocks can be expected to be found in the brain of a small mammal and in a human brain, though a large brain may have many more of these building blocks. The point is that we should search for basic principles that are reasonably simple (
Fig.
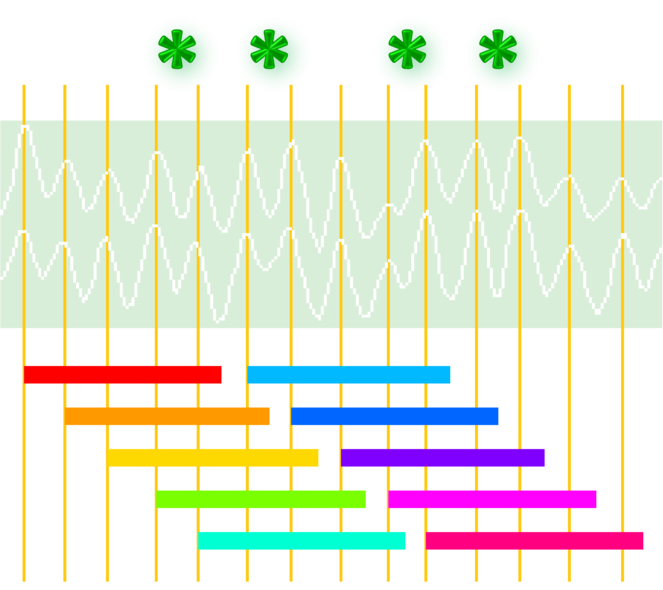
The two levels hypothesis. The colorful horizontal lines represent the duration of high activity in individual columns. The vertical lines show the time relation to the alpha waves. The distance between two neighboring lines is the wavelength, and the green symbols indicate that some waves are a little bit shorter than other waves.
Signals from a regulating system
The number of highly active columns alternates between a lower limit and an upper limit (
At the upper limit, the regulating system decreases the excitability in columns with activity in the low-activity range. Thus, the regulating system causes small but synchronous changes in excitability in columns with low activity, and these changes can be recorded as alpha waves.
Data of the type shown in Fig.
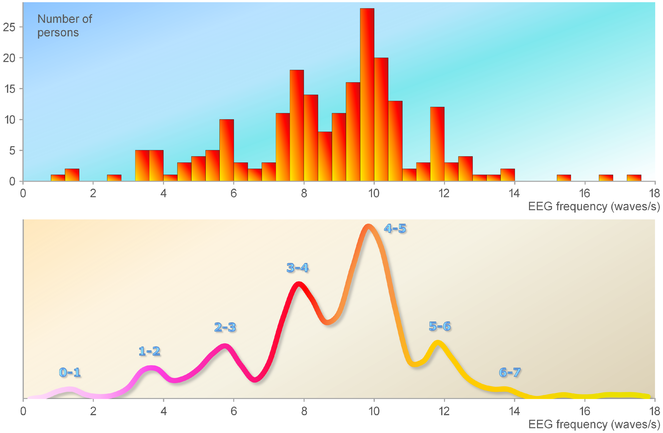
Number of highly active columns and EEG frequency. The histogram shows the distribution of the frequency for 213 individuals. The data are from a pilot study described in another paper (
Three alpha groups
There are three main groups of alpha waves (
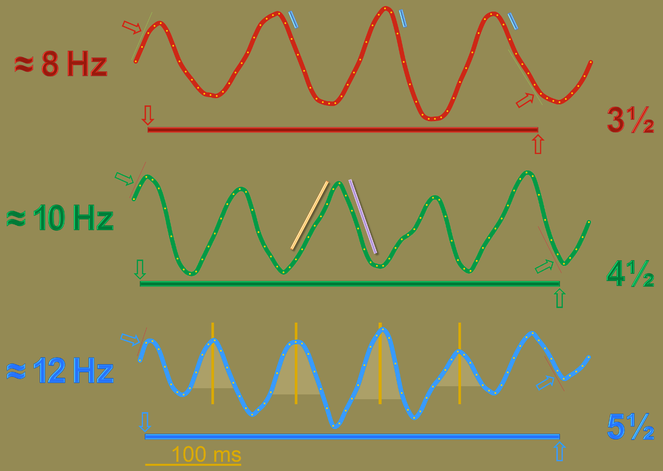
Three types of alpha waves. The arrows indicate the beginning and the end of high activity in a column. The horizontal lines represent the duration of activity at the high level. The small blue bars indicate that the initial part of the downward slope often has a decisive start. The yellow and purple bars indicate that the upward slope is less steep than the downward slope. The vertical lines illustrate how the wavelength was measured. The EEGs are from participants 59, 51, and 149 in a previous study (
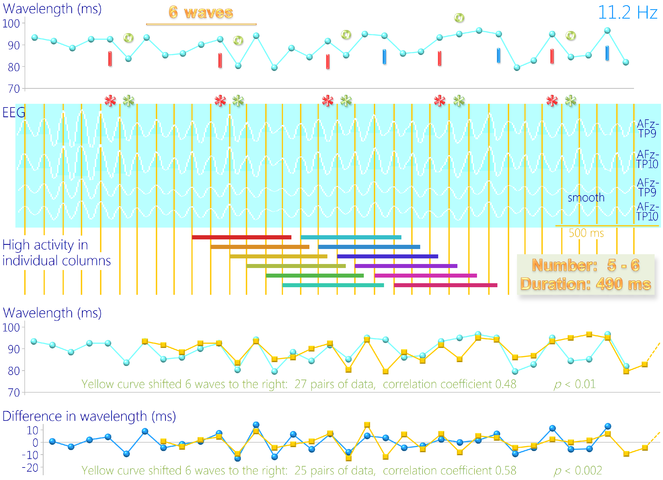
The duration of the high activity in a column can be measured if the number of highly active columns is known. For example, in the alpha group at 12 Hz, the limits for the number are expected to be 5–6, and then the duration is approximately 5.5 times the wavelength (Fig.
Patterns in the wavelength variation
The existence of the frequency groups in Fig.
Thus, when the high activity in a column happens to start a little bit early, it may also stop a little early. Then the next column can start its high activity slightly early. This should generate a pattern in the variation of the wavelengths, and the elements in the pattern should be repeated at an interval that matches the duration of high activity.
Such patterns were indeed found, and this discovery is reported in the present paper. Fig.
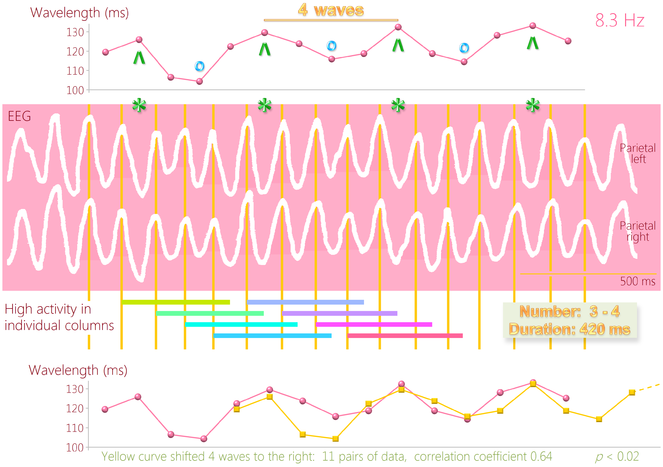
Variation in wavelength at 8.3 Hz. The green and blue symbols indicate that there is a monophasic pattern and that the interval for the repeated elements is four waves. The x-axis in the upper diagram has the same timescale as the EEG. For statistical analysis, the x-axis in the lower diagram is a category axis. The colorful horizontal lines illustrate the hypothesis that was tested. The data are from a 22-year-old female.
Methods
The variation in the length of EEG waves is difficult to study because of disturbances and stochastic noise. Although there are methods for removing artifacts (
Approval was obtained from the Regional Ethics Board of the University of Göteborg (R627–97) and informed written consent was obtained from the participants. Sequences of alpha waves were recorded from 200 participants while they rested with their eyes closed. The recording technique has been described in a previous paper (
The alpha waves were often asymmetrical, and the polarity was chosen so that, on average, the upward slope was less steep than the downward slope (Data S1 in Suppl. material
In Fig.
It is always possible that the elements in a pattern are repeated by chance. The probability for this can be calculated. In a diagram showing the measured wavelengths, the curve was moved sideways and compared with the original curve (Data S2 in Suppl. material
Results
Repetitions in the wavelength variation were explored, and distinctive patterns were found. An example of such a pattern is shown in Fig.
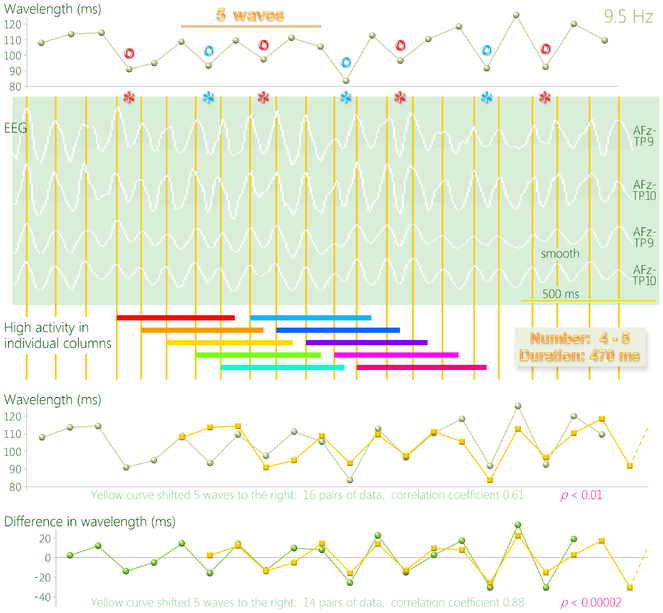
When attempting to detect a pattern in the wavelength variation, the analyzed sequence of waves must be fairly long, and every single one of the waves in the sequence must be clear and clean. For that reason, it is quite difficult to find sequences of alpha waves where the variation in wavelength can be analyzed.
Occasionally, a tendency for a pattern in the wavelength variation can be seen directly in a sequence of alpha waves, but most often, the variation in wavelength has to be analyzed in a diagram before the patterns become visible. It helps to know what to look for, and without the two levels hypothesis, it is unlikely that the patterns would have been found.
About ten percent of the participants had sequences of alpha waves that were long enough and without too much of disturbances and noise. All of these sequences contained patterns, and all of the patterns had elements that were repeated at intervals that were in agreement with what can be expected from Fig.
Smoothing destroyed the shape of the waves, but the elements in a pattern became a little easier to see. The smoothed curves in Fig.
To reduce the effect of slow fluctuations in wavelength, a difference in wavelength was used on the y-axis in the lowermost diagram in Fig.
The interval for the repeated elements is five waves in Fig.
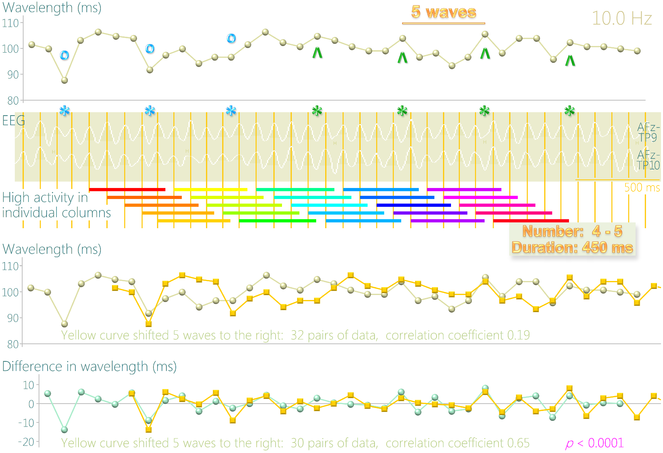
Variation in wavelength at 10.0 Hz. The blue and green symbols indicate elements that are repeated at an interval of five waves. The pattern was not clear when there was almost no variation in wavelength, as in the middle of the sequence. Fortunately for the analysis, this period with almost no variation was not long-lasting. The letter H refers to disturbances from the heart. The EEG is from a 29-year-old male.
The patterns in the wavelength variation changed over time. When sequences of alpha waves were relatively long, as in Fig.
Discussion
The finding of highly specific patterns in the wavelength variation strengthens the two levels hypothesis. The elements of the patterns were repeated at intervals that exactly matched the predicted duration of high activity in individual columns.
In the alpha groups around 8 Hz, 10 Hz, and 12 Hz, three different intervals for the repeated elements had to be found to confirm the hypothesis (Fig.
The idea behind the two levels hypothesis
The theoretical work that led to the two levels hypothesis was published many years ago (
Observations made from within the brain provide valuable clues as to how activity in the forebrain is organized. There are three clues that are particularly important (
(1) High or low activity
The first clue concerns the degree of activity. Observations from within the brain indicate that there is a clear difference in the degree of mental activity when something is present in consciousness and when that something has disappeared from the conscious level. Therefore, activity can be found on two separate levels.
The functional units in the brain that are of interest in this context are the columns in the cerebral cortex. These units must be organized in a way that allows activity in a column to be either at a high level or at a low level.
(2) A few at a time
The second clue concerns the number of highly active columns. A very small part of all that may appear in consciousness is actually appearing there at any given moment in time. Consequently, only a few of the columns can be highly active at a time.
When the activity in one column has dropped from the high level to the low level, the activity in another column may jump up to the high level. This results in a turnover of highly active columns and gives a flow of thoughts and feelings.
(3) Functional properties = connections
The third clue is about functional properties. Anything that may appear in consciousness is characterized by its properties, and here, a property is a connection to something else that may appear in consciousness.
Thus, each cerebral column must have a set of connections with other columns. These connections have a double function. They can be used for associations in cognitive processes, and they constitute the functional properties that characterize every cerebral column.
The activity when we are thinking
The colorful horizontal lines in Figs
Simplifying principles can be helpful, and as a simplification, the high activity in the cerebral columns during a sequence of alpha waves can be considered to be a thought. It is not always clear where one thought ends and the next begins. It can also be difficult to decide where a sequence of alpha waves ends and the next sequence begins. However, a sequence of alpha waves is not a thought in itself. The alpha waves just reflect the efforts of the regulating system that occur during a thought (
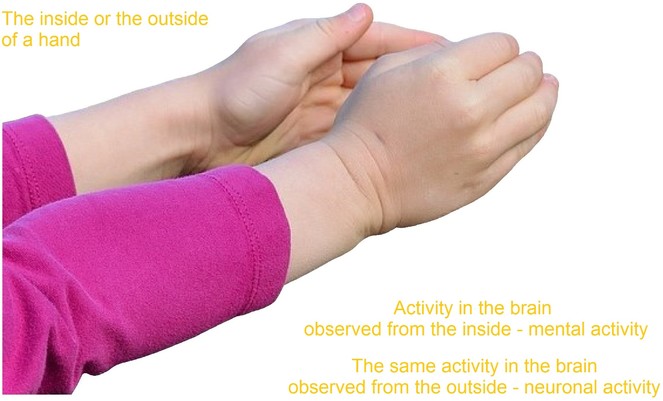
The problem with a neural correlate to a thought
It is tempting to say that the colorful horizontal lines in Figs
In a similar way, it is not a good idea to search for a correlate to a thought. When high activity in the columns is observed from the inside, this activity can be described as the mental activity that constitutes a thought, and when high activity is observed from the outside, the activity can be described as neuronal activity. However, it is still the same activity in the brain, not two correlates.
Number and duration
The discovery of patterns in the wavelength variation makes it possible to determine the actual number of highly active columns. Moreover, the duration of high activity in individual columns can be measured in a reliable way. Fig.

Overview for number and duration. The values in the center of the figure are thought to be optimal and associated with good health. Slightly suboptimal values may lead to anxiety and depression. Values clearly outside the optimal ranges are expected to cause mental disorders. Optimal values for children are not the same as those for adults. During epileptic seizures, number and duration are changed in a special way.
The values for number and duration shown in the center of Fig.
In Fig.
Epilepsy
The actual number of highly active columns is usually the same as the limits used by the regulating system. For example, when the limits are 4–5, the number should be 4–5. If the regulating system makes a mistake, the number can end up outside the limits. It has been suggested that the number alternates between the upper limit and one step higher during grand mal seizures (
In petit mal seizures, the number may alternate between the lower limit and one step lower (Fig.
How duration was measured
The values for the duration of high activity given in the center of Fig.
As an example, the mean number of highly active columns is approximately 4.5 when the number alternates between 4 and 5. The value cannot be exactly 4.5 because alpha waves are somewhat asymmetrical. The true value is probably slightly less than 4.5, but this value is difficult to measure in an accurate way (Figs
The start of high activity
The colorful horizontal lines in Figs
In Figs
Asymmetrical waves
The regulating system must react as quickly as possible when a new column starts its high activity. This is a critical moment, and if the system is not successful, the number of highly active columns may exceed the upper limit, which may lead to a grand mal seizure (
When the activity in a new column jumps up to the high level and the upper limit is attained, the decrease in excitability in columns with low activity must begin decisively (as illustrated by the small blue bars in Fig.
Duration disorders
A previous study found high scores on anxiety and depression when the duration was either slightly too long or slightly too short (
Within the optimal range, a long duration gives reliable associations when we are thinking (
Short duration can be linked to impulsive thinking and behavior (
If the duration is more than slightly outside the optimal range, the result will be disorders that are more serious (Fig.
Number disorders
When looking at the colorful horizontal lines in Fig.
A high number may lead to complicated thoughts. If the number is too high, one can imagine that very complicated associations in thinking processes could be difficult to handle. The result would be incoherent thinking and other problems (
Disorders during childhood
The limits for the number changes stepwise and the duration changes gradually. Babies may start with 1–2 as the limits for the number (
For normal development, it is necessary that both number and duration increase, but not too early and not too late. This gives four main alternatives for what can go wrong with number and duration during childhood.
Why measurement before treatment
A medication or other treatment that shortens the duration can be helpful if depression is the result of a duration that has become too long. On the other hand, such a shortening treatment would worsen the symptoms if given to a patient where the duration is already too short.
Thus, the outcome of an antidepressant medication may depend on whether depression is caused by a duration that is too short or too long. This is of crucial importance when testing a medication. If we have a mixed group of patients with different types of depression, we will most likely get a mixed outcome. An effective treatment that can shorten or prolong the duration will probably be dismissed as ineffective because of the mixed results. This mistake can be avoided if there are duration measurements before and after treatment.
How to find the best treatment
The data in Figs
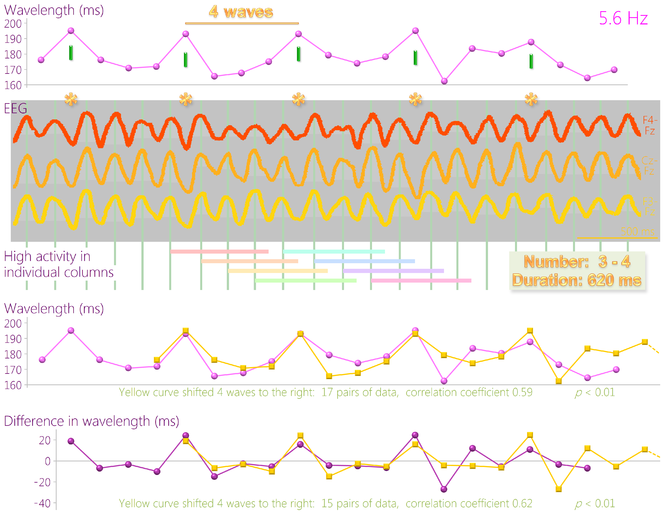
Fig.
The number 3–4 and the duration 620 ms in Fig.
It is possible that a too-high number and a normal duration existed before the medication was started. At a later stage, due to overtreatment or something else, the duration became too long. Another possibility is that the duration was too long from the beginning and that this unusually long duration caused psychotic symptoms.
To find the best treatment is less problematic if we know the cause of a mental disorder. Imprecision in old diagnoses is often an impediment. When measurements of number and duration are available, we may instead talk about number and duration disorders.
Conclusions
- Patterns in the wavelength variation confirm the two levels hypothesis.
- The number of highly active columns and the duration of high activity in individual columns can be measured.
- There are implications in areas such as personality, childhood development, epileptic seizures, and mental disorders.
Open science
In the discussion section, an attempt is made to explore various alternatives when number and duration are suboptimal. All of the suggestions can be tested, but this will require collaboration and help from open science (
The present report describes highly specific patterns in the wavelength variation. These patterns are important because they confirm a hypothesis that explains how forebrain activity is organized. The data collected so far support the hypothesis, but more data would be most welcome.
If anyone has a recording with a reasonably long sequence of alpha waves where the amount of noise and other disturbances is minimal, please send a copy of the waves to me (email: tomas.johannisson@outlook.com).
Acknowledgements
I wish to thank Jonatan Wistrand and Vincent Wistrand for the valuable discussions.
Funding program
There was no external funding.
Conflicts of interest
The author has declared that no competing interests exist.
References
-
A review of alpha activity in integrative brain function.International Journal of Psychophysiology86:1‑24. https://doi.org/10.1016/j.ijpsycho.2012.07.002
-
Interpreting EEG alpha activity.Neuroscience & Biobehavioral Reviews44:94‑110. https://doi.org/10.1016/j.neubiorev.2013.05.007
-
The mind–body problem: A psychobiological approach.1st ed.Pergamon Press,Oxford, New York. [ISBN9781483150123]
-
Automated artifact removal from the electroencephalogram: A comparative study.Clinical EEG and Neuroscience44:291‑306. https://doi.org/10.1177/1550059413476485
-
Shifting gears: Seeking new approaches for mind/brain mechanisms.Annual Review of Psychology64:1‑20. https://doi.org/10.1146/annurev-psych-113011-143817
-
Atlas of electroencephalography: Volume 1, Methodology and controls.2nd ed.Addison-Wesley,Cambridge, Massachusetts. [ISBN9780201023602]
-
An adaptive singular spectrum analysis method for extracting brain rhythms of electroencephalography.PeerJ5: 3474.https://doi.org/10.7717/peerj.3474
-
Forebrain function: A theory about the general organization.Medical Hypotheses13:317‑327. https://doi.org/10.1016/0306-9877(84)90165-8
-
Mano-depressive disorders.Medical Hypotheses41:332‑333. https://doi.org/10.1016/0306-9877(93)90077-4
-
Schizophrenic symptoms.Medical Hypotheses41:329‑331. https://doi.org/10.1016/0306-9877(93)90076-3
-
The alpha rhythm in the EEG: A theory based on a neurophysiological model.Medical Hypotheses46:557‑561. https://doi.org/10.1016/S0306-9877(96)90131-0
-
Correlations between personality traits and specific groups of alpha waves in the human EEG.PeerJ4: 2245.https://doi.org/10.7717/peerj.2245
-
EEG in psychiatry.American Journal of EEG Technology29:219‑234. https://doi.org/10.1080/00029238.1989.11080300
-
From neuron to brain: A cellular approach to the function of the nervous system.Sinauer Associates,Sinauer Associates. [ISBN9780878934423]
-
Building and hacking open source hardware.Res Ideas Outcomes4: e31701.https://doi.org/10.3897/rio.4.e31701
-
The columnar organization of the neocortex.Brain120:701‑722. https://doi.org/10.1093/brain/120.4.701
-
Electroencephalography: Basic principles, clinical applications, and related fields.5th ed.Lippincott Williams & Wilkins,Philadelphia, London. [ISBN9780781751261]
-
From open access to open science from the viewpoint of a scholarly publisher.Research Ideas and Outcomes3: e12265.https://doi.org/10.3897/rio.3.e12265
-
The open biodiversity knowledge management system in scholarly publishing.Research Ideas and Outcomes2: e7757.https://doi.org/10.3897/rio.2.e7757
-
Mind-brain interaction: Mentalism, yes; dualism, no.Neuroscience5:195‑206. https://doi.org/10.1016/0306-4522(80)90098-6
-
Automatic removal of high-amplitude artefacts from single-channel electroencephalograms.Computer Methods and Programs in Biomedicine83:125‑138. https://doi.org/10.1016/j.cmpb.2006.06.003
Supplementary material
Data S1. EEGs for Figs. 4–7 and 10.
Data S2. Tables for the measurements and analyses behind Figs. 4–7 and 10.
Data S3. Additional methods for measurement and analysis of the EEG in Fig 5.
Data S4. A sequence with 70 alpha waves and different measurement methods.