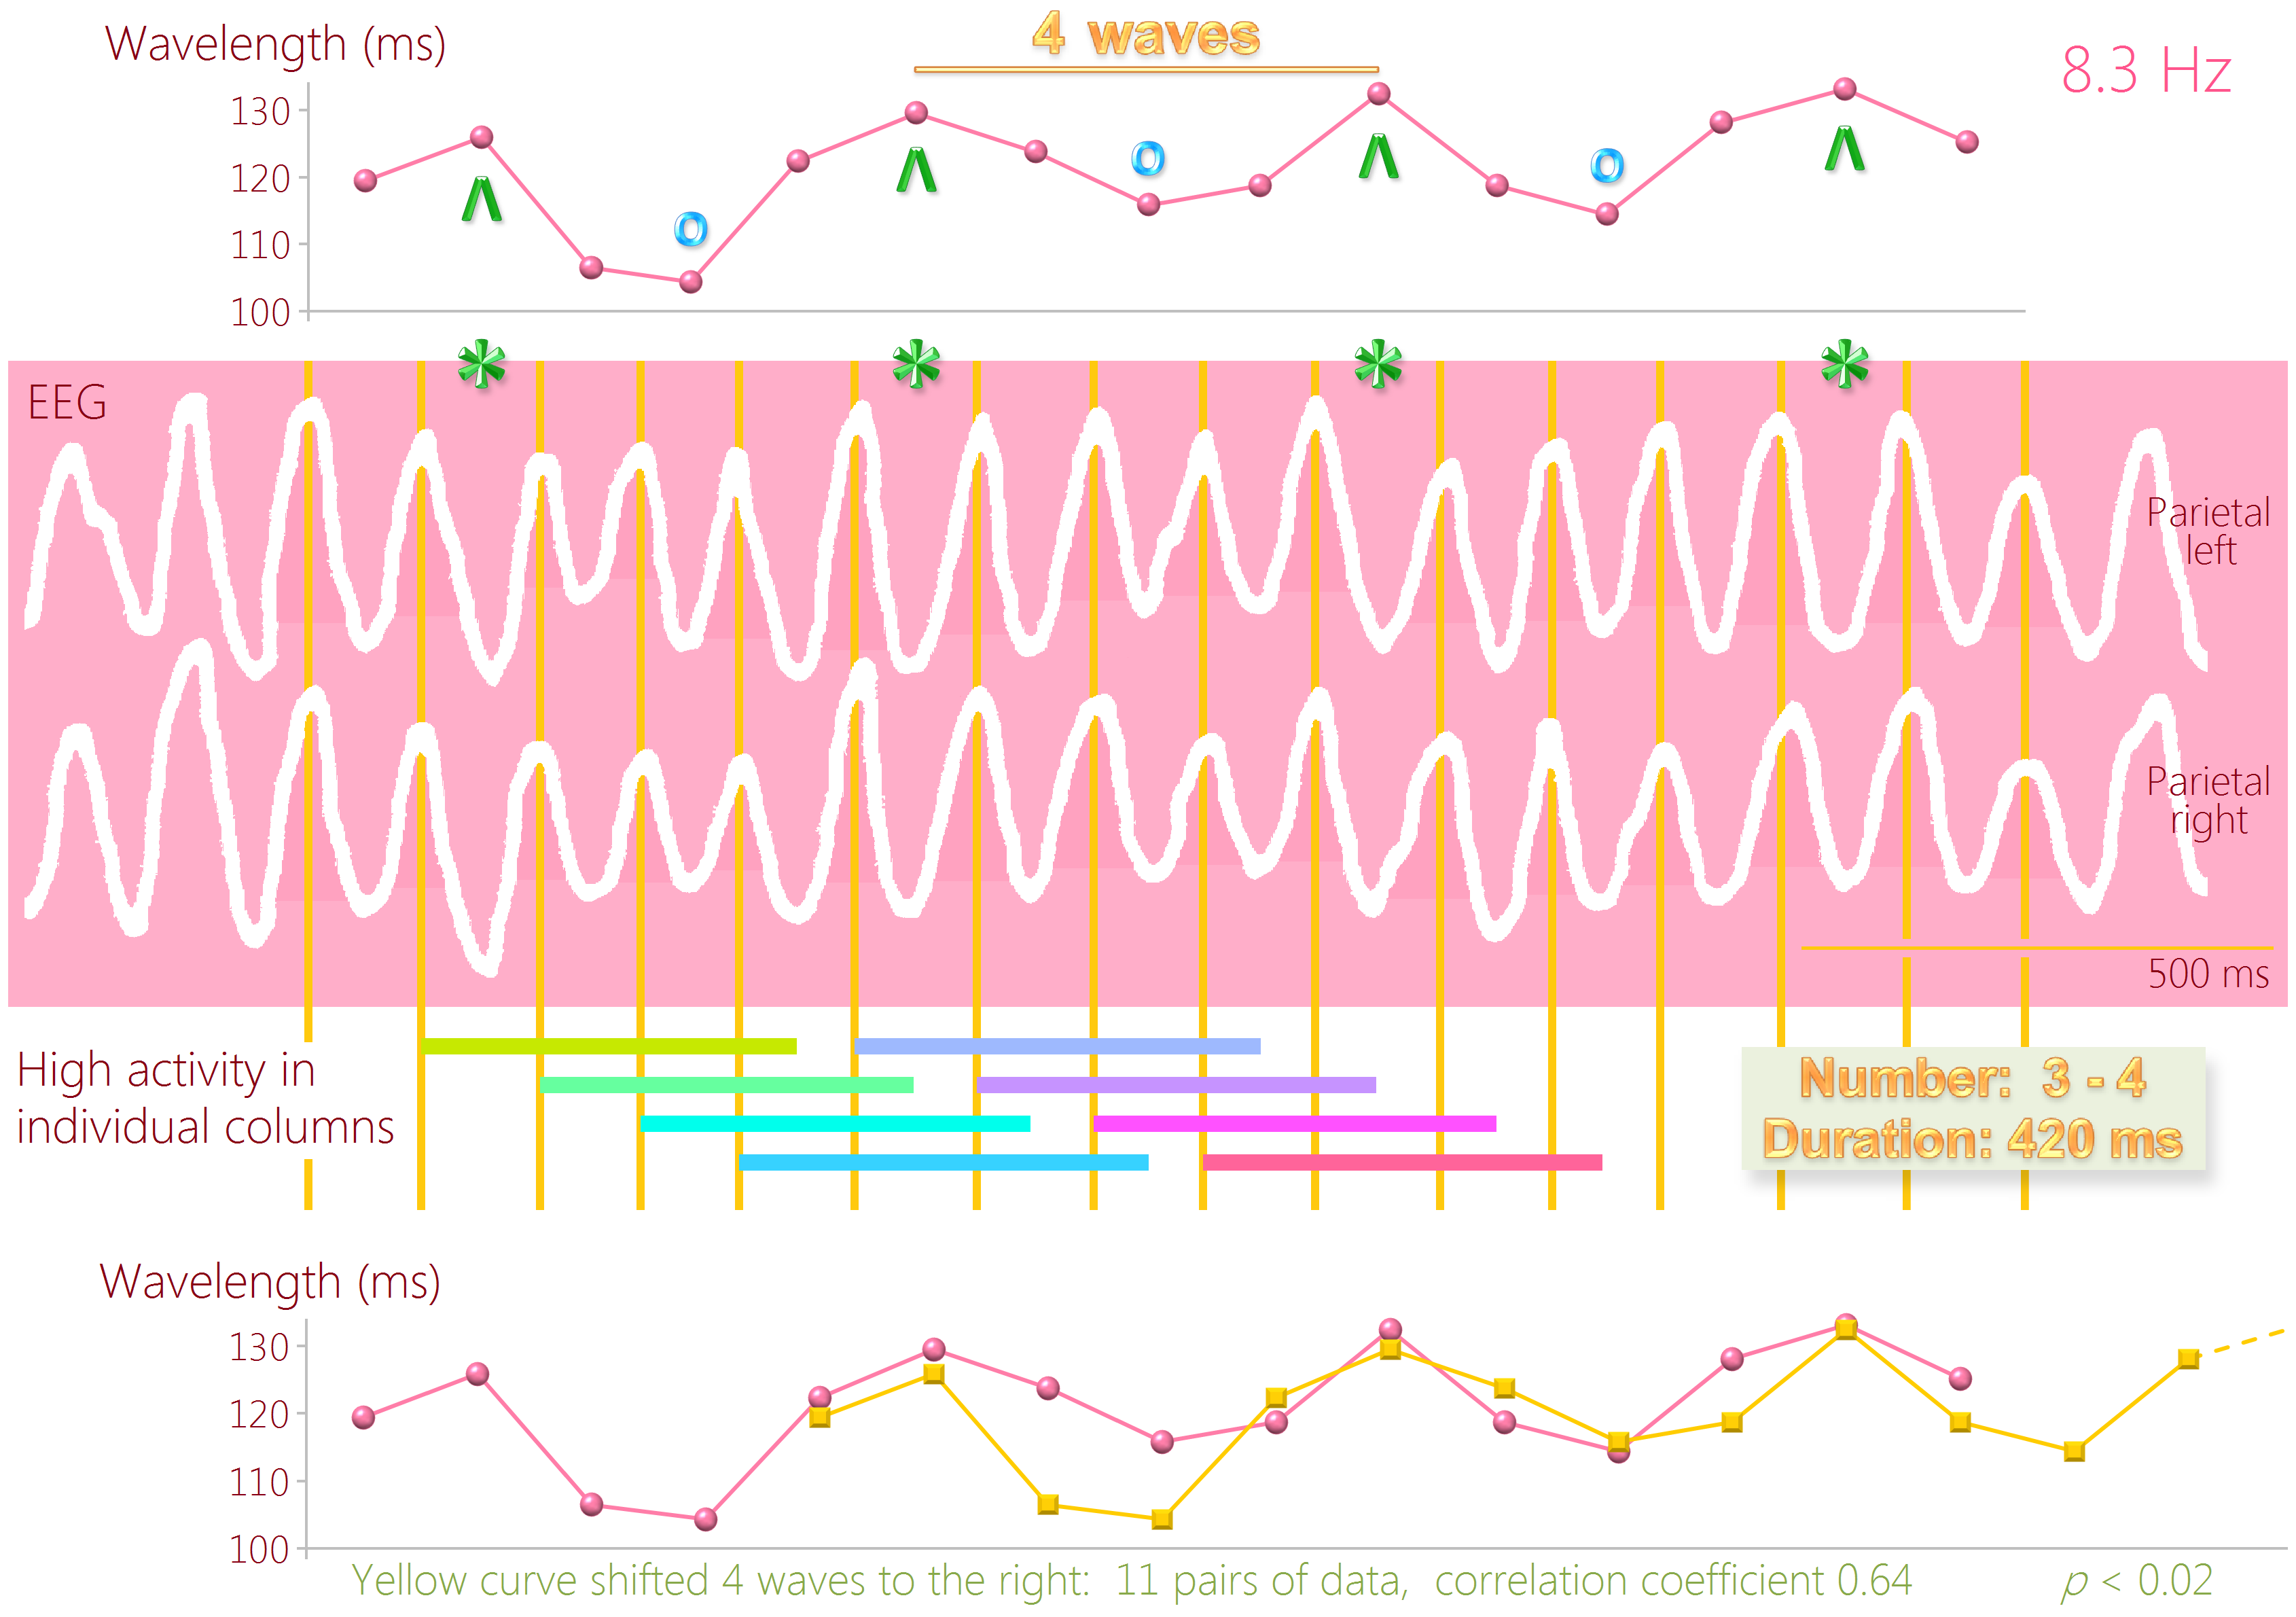
Variation in wavelength at 8.3 Hz. The green and blue symbols indicate that there is a monophasic pattern and that the interval for the repeated elements is four waves. The x-axis in the upper diagram has the same timescale as the EEG. For statistical analysis, the x-axis in the lower diagram is a category axis. The colorful horizontal lines illustrate the hypothesis that was tested. The data are from a 22-year-old female.