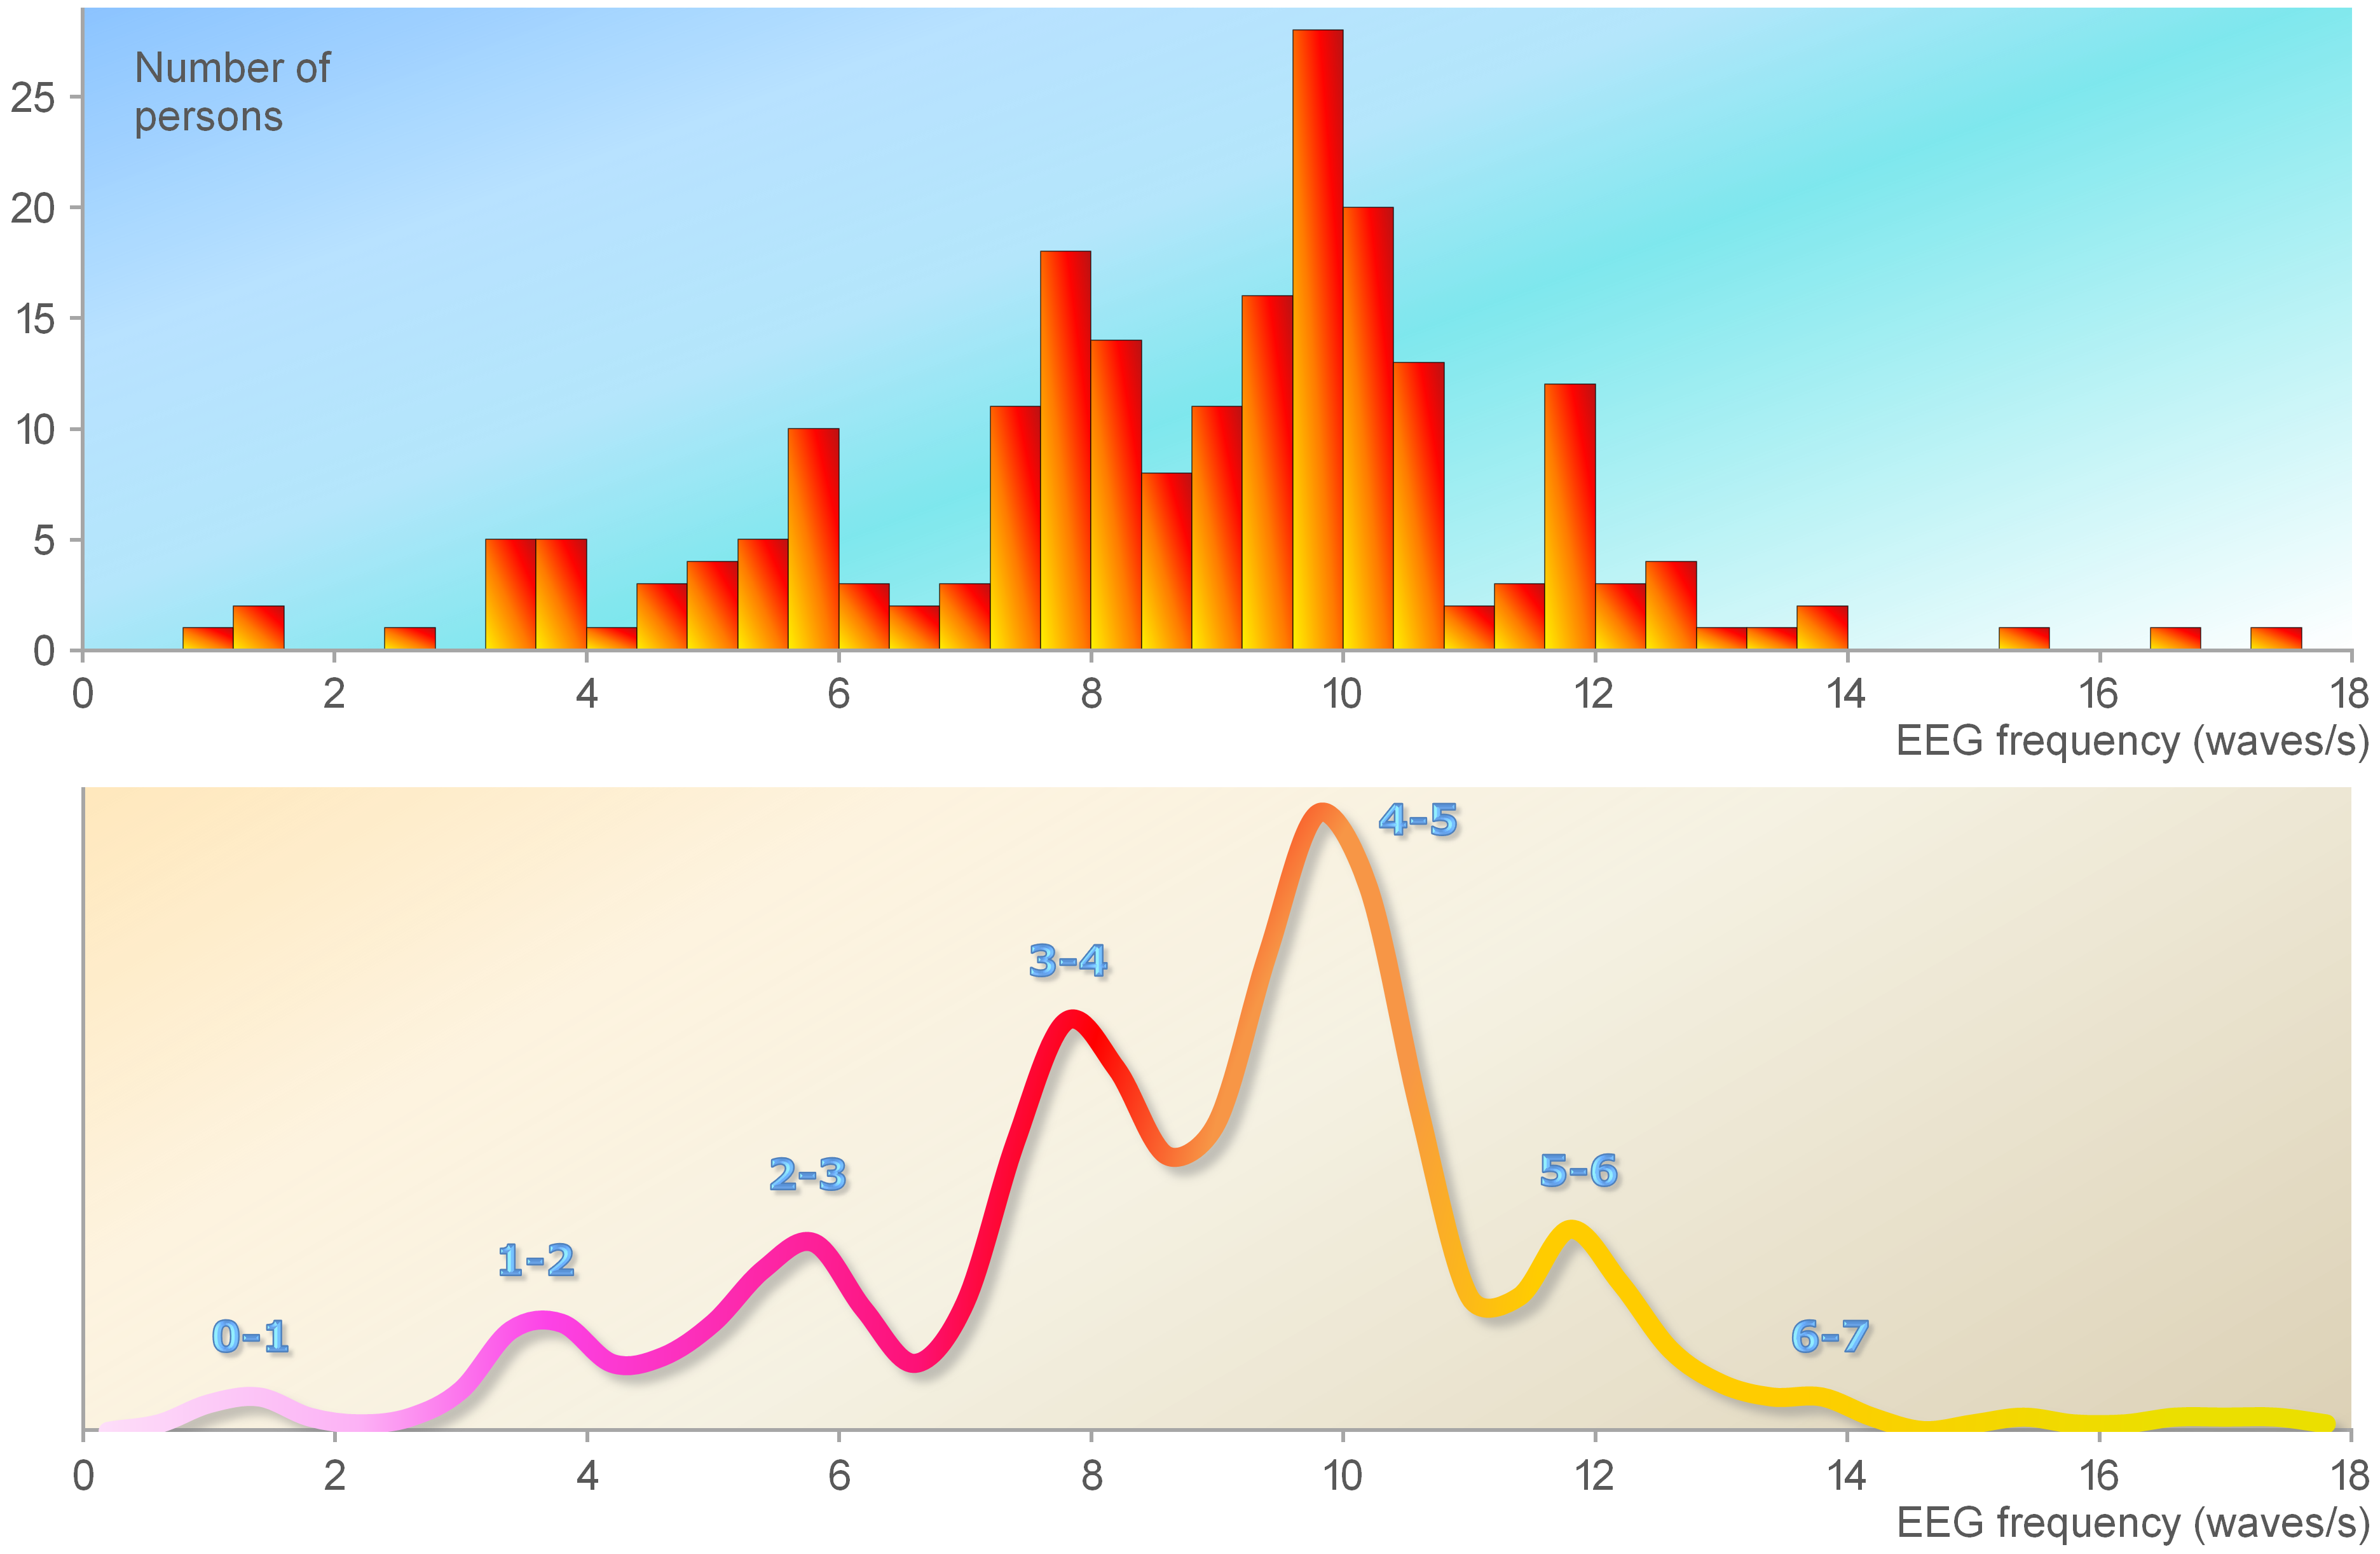
Number of highly active columns and EEG frequency. The histogram shows the distribution of the frequency for 213 individuals. The data are from a pilot study described in another paper (
|
|
||
|
Number of highly active columns and EEG frequency. The histogram shows the distribution of the frequency for 213 individuals. The data are from a pilot study described in another paper ( |
||
| Part of: Johannisson T (2020) Variation in length of alpha waves reveals how forebrain activity is organized. Research Ideas and Outcomes 6: e49942. https://doi.org/10.3897/rio.6.e49942 |