|
Research Ideas and Outcomes : Policy Brief
|
|
Corresponding author: Evelyn Underwood (eunderwood@ieep.eu)
Received: 16 Aug 2017 | Published: 17 Aug 2017
© 2017 Evelyn Underwood, Miriam Grace
This is an open access article distributed under the terms of the Creative Commons Attribution License (CC BY 4.0), which permits unrestricted use, distribution, and reproduction in any medium, provided the original author and source are credited.
Citation: Underwood E, Grace M (2017) The use of biodiversity data in rural development programming. Research Ideas and Outcomes 3: e20369. https://doi.org/10.3897/rio.3.e20369
|
|
Abstract
This study focuses on rural development policy implementers and evaluators as users of European biodiversity data. It critically analyses the use of biodiversity data for measuring the impact of agri-environment programmes and related rural development funding, and highlights good practices from a range of countries. The examples show the possibilities for better targeting and evaluation of agricultural funding to biodiversity conservation if sufficient biodiversity data are available and are used in policy. However, many biodiversity datasets exist at the national or regional but are still not integrated in the RDP monitoring system and thus not accessible to evaluators, and many RDPs still feature only the obligatory EU-level indicators. It is important to differentiate between the need for standardised EU-level datasets that can be used for an overall assessment of the impact of the CAP, where there is still a huge data gap, and the national or regional programming level, where there are often existing data that are not being used for various reasons. The study is part of the EU BON project, which aimed to build an integrated biodiversity information system for Europe.
Keywords
biodiversity data, high nature value farming, high nature value farmland, HNV, agri-environment, monitoring, evaluation of impact, European Union, Rural Development Programmes (RDPs), common farmland Bird Index, species of EU conservation concern, habitats of EU conservation concern, agricultural practices, nature conservation, land cover data, species occurrence, habitat distribution, EU BON
Key questions and premises
Agricultural land is of great importance for biodiversity in Europe as it occupies approximately 40% of the total land area and includes biodiversity-rich habitats and landscapes that have developed in close relationship with low intensity agriculture. The High Nature Value (HNV) farming systems include traditionally managed hay meadows and semi-natural pastures, and mixed farming landscapes with high densities of habitats such as hedges, ponds, ditches, copses and woodland patches, and other field edge habitats (
This study focuses on rural development policy implementers (and associated sectoral stakeholders) as users of European biodiversity data and potential users of the EU BON biodiversity portal and related tools. Public policy-makers rarely use data sources directly, but are informed by reports and briefings in which the data are interpreted and synthesised. In the case of RDPs, the key primary data users are public institutes and private consultancies that are providing ex ante baseline assessments, implementation reports, and ex post evaluations for policy implementers. Key secondary data users are farmers and agricultural organisations and the public authorities who are responsible for the implementation.
The study focuses on the identification of criteria that have enabled successful use of biodiversity data in rural development planning and targeting, the barriers to use of existing data sources, and the key data gaps that hinder effective implementation. It contributes to the EU BON project objective to identify and pilot new approaches to overcome gaps in biodiversity data in conservation policy at European and national levels.
This project firstly reviewed the current legislative framework and guidance on rural development programming to identify policy relevant uses of biodiversity data, secondly reviewed the available biodiversity indicators and data sources used to target and evaluate agricultural policy, and thirdly carried out a series of case studies to identify the key aspects of the use of biodiversity data in rural development programming using literature and interviews.
Biodiversity information and data requirements for Rural Development Programming
This section describes the requirements for biodiversity information and data that arise from EU rural development programming. Biodiversity data play a role in three key processes within the rural development programming cycle, namely policy targeting, monitoring and evaluation. In particular;
- Biodiversity data sources are needed for the indicators that Member States use to describe the state of biodiversity in their agricultural areas, their resulting programming needs and corresponding measures, and the impact of those measures, as defined by the Common Monitoring and Evaluation Framework (CMEF)*
2 . RDP evaluation must be carried out by independent evaluators, and the rural development programming authority has the responsibility to ensure that the evaluators have sufficient data on general trends, outputs and results to carry out their evaluation. Member States have developed various monitoring and biodiversity data utilisation frameworks to attempt to evaluate the impact of their programme on biodiversity, as described in their programme evaluation reports. - Biodiversity data are required in order to better target certain rural development measures and payments to particular areas or types of farmland where they will have most benefit for biodiversity.
Biodiversity data needs for monitoring impacts and evaluating success of RDP measures
The Common Monitoring and Evaluation Framework requires the use of a set of indicators including context and baseline indicators, result indicators, target indicators, and impact indicators, as illustrated in Fig.
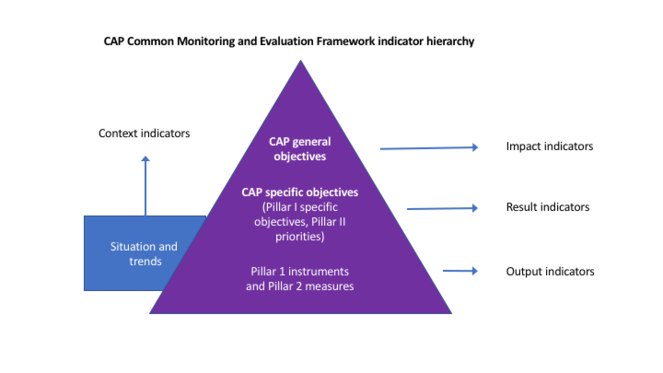
The Commission has responsibility for producing guidance on the assessment of values for the result indicators, on how to assess impacts, and on answering the common evaluation questions, proposing additional data, judgement criteria and a range of possible approaches to answer the evaluation questions*
Biodiversity data needs for targeting RDP measures at biodiversity conservation
Member States have the option of targeting rural development payments to particular areas or farm types, such as areas of high biodiversity value. This requires a method for mapping the relevant areas where measures to benefit particular types of biodiversity are expected be most effective, either because the target species or habitat is already there and the measure will secure or increase its distribution and population, or because the target species can be attracted back into the area through the measure or the habitat can be recreated under particular conditions and linked to existing habitat. Targeting requires distribution maps of the target species and habitats at a scale that is fine enough to be relevant to individual farms; and the integration of the target maps into the IT system in which selection, prioritisation and allocation of rural development payments is managed, and also ideally into the Land Parcel Identification System that registers individual farm parcels and associated rural development contracts.
Relevant biodiversity indicators and data sources
This section examines the use of biodiversity data sources in the most frequently used indicators in more detail:
- Common farmland bird index
- Conservation status of agricultural habitats - grassland
- High Nature Value (HNV) farming indicator and mapping
- Other indicators - bats and butterflies
Common Farmland Bird Index
The common farmland bird index (CFBI) is calculated by each EU Member State from the results of national breeding bird surveys using a common methodology (
National breeding bird surveys are large-scale monitoring projects carried out by ornithologist volunteers using comparable methods that estimate the abundance of the more common bird species. Surveys are carried out in all EU Member States; the UK has the longest-running scheme, starting in 1966, while the Lithuanian scheme is the most recent, starting in 2011*
Bird counting approaches may include territory mapping, line transects and point counts. Site selection is most commonly done using stratified random selection of sampling sites. National coordinators collect the yearly all-site totals for each species by summing the counts from sample sites. In those counting schemes based on free choice of sample sites, weighting is used to counteract the effect of oversampling particular strata and reduce the bias in the index. Data are subject to quality control at multiple levels. At the national level, this is performed by the monitoring scheme, which ensures that volunteer surveyors are adequately trained. Automatic tools apply appropriate restrictions to data as it is entered. The TRIM (Trends and Indices for Monitoring data) programme is used to control for the effect of missing values, which are common in count data (see Suppl. material
The national data are used to compute European-level trends through the Pan-European Common Bird Monitoring Scheme (PECBMS) (see Fig.
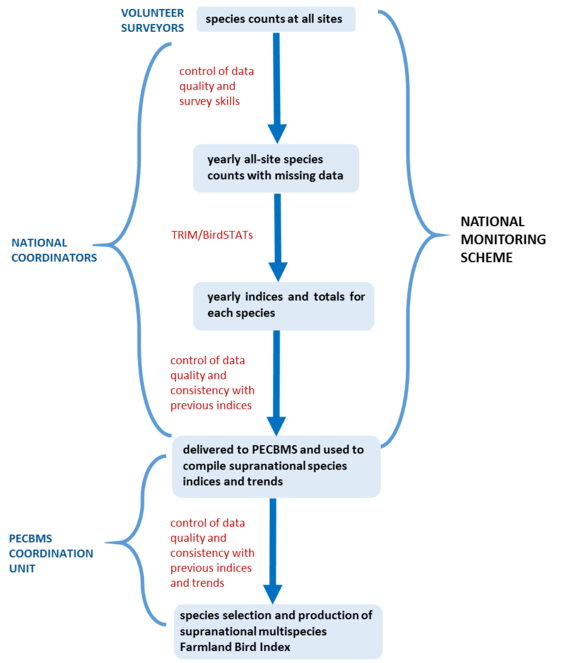
Workflow of the production of the EU Farmland Bird Index. Adapted from source: http://www.ebcc.info/wpimages/schema2016_big.jpg
Conservation status of agricultural habitats - grassland
In Europe, semi-natural grasslands are of considerable importance for biodiversity and are widely used for agriculture, primarily for grazing (i.e. as pastures) and/or for hay production (ie. as meadows). Indeed, as semi-natural grasslands, they are partly or completely dependent on continued grazing and/or mowing to continue existing, as they would otherwise be succeeded by scrub and trees. Semi-natural grasslands are also unmodified by agricultural improvements, such as drainage or fertilisation, and therefore often species-rich and/or support rare species and communities. In recognition of their potential biodiversity value, the conservation status of grassland agricultural habitats is an obligatory context indicator for rural development programming. This CMEF indicator is actually the conservation status and distribution of the natural and semi-natural grassland habitat types listed in Annex I of the EU Habitats Directive as reported by Member States for the 2007-2012 period (
Many Member States have carried out field surveys of grassland habitats to inform their reporting under the Habitats Directive. For example, the Irish semi-natural grasslands survey carried out between May 2007 and September 2012 mapped a total of 23,188 ha of semi-natural grassland habitats (
Other data sources relevant to semi-natural grassland mapping are being developed, alhtough methods and classification systems differ (
Some examples of national level spatial grassland datasets are given in Suppl. material
High Nature Value (HNV) farming indicator and mapping
High Nature Value farmland (HNVF) comprises areas where agriculture is a major (usually dominant) land use and where that agriculture supports or is associated with either a high species and habitat diversity, or the presence of species of European and/or national and/or regional conservation concern (
The Common Monitoring and Evaluation Framework requires that EU Member States assess the extent, condition and dynamics of HNV farmland, and HNV farmland is used as a context, result and impact indicator. There are common guidelines but there is no standardised procedure for assessing the HNV indicator across the EU, due to the variations in data availability and land types. Data sources may include CORINE Land Cover, Land use/cover area frame survey (LUCAS) and other land cover data, Integrated Administration and Control System (IACS) data on crop diversity, livestock types and density, fertiliser application, etc, Land Parcel Information System (LPIS) cadastral data, Farm Structure Survey (FSS) data, species and habitat distribution databases, specific sampling surveys, Rural Development Programme monitoring data, and maps of designated protected areas (Natura 2000 protected habitats, national nature reserves, etc.).
Identifying and mapping HNVF can be approached using three different types of data:
- Land cover data to map a) presence of semi-natural habitats in farmland and b) density of landscape features and/or small parcel size to delineate mosaic farmland;
- Farm system information to characterise and map farms with low intensity management (e.g. fertiliser use, soil productivity);
- Distribution and occurrence of semi-natural habitats and protected species using a) maps of protected areas, b) habitat surveys, and/or c) species distribution data.
Member States are still carrying out their baseline calculations of HNV farmland (
The HNV land cover approach is most effective at identifying HNVF when used in combination with species distribution data and other farming data. However, there are a number of challenges to using habitat and species data: there are far more data for certain taxa, especially birds, than for others, with the result that some farmland habitats are poorly represented; geographical coverage of datasets is highly variable and rarely complete; the spatial resolution generally is poor (e.g. presence/absence of species in a 10x10 km square); data are often not recent; and time series data are available for only a few species so temporal resolution is low (
Efforts have focused on HNV identification methods that can be used to improve the interpretation of land cover data using farming systems data. The European Commission’s Joint Research Centre has developed a simple methodology for HNV measurement that uses EU level data sources to estimate the density of ‘biodiversity friendly farming practices’ at the regional (NUTS2) level in order to improve land cover interpretation (see Suppl. material
Other approaches combine agricultural statistics on extensive farming practices (livestock density and irrigated area) and crop diversity (Shannon’s evenness index and crop richness) with spatially explicit data on landscape elements (natural constraints, arable area vs forest, Shannon’s landscape diversity and evenness indices, edge density and others) at the local administrative unit (LAU) level (
This HNV mapping approach was tested in France and the Netherlands using farm structure survey (FSS) data collected at the local administrative level (LAU) on crop diversity at farm level (weighted by UAA), share of permanent grassland in UAA, and share of afforested farm areas in UAA (
This HNV approach was trialled using data from IACS and LPIS in Lower Saxony, Germany, to identify and assess values for HNVf extent at municipality (LAU-2) level (
Sample site field surveys can fully identify HNVF type 1 with no additional identification method needed, and this produces statistically rigorous information on trends in indicator species and habitats that is sensitive to change. Germany has developed the most systematic HNV monitoring methodology (see Suppl. material
A study tested how closely the German HNV farmland indicator was associated with bird species abundance, richness and community composition, particularly of specialist species, using German Common Bird Census data provided by the Federation of German Avifaunists gathered from the same sample plots as the HNV indicator data (
Denmark has created a 10 m x 10 m resolution map of HNV farmland, which is integrated into the LPIS and used to target RDP funding at HNV farmland (see section below for more details). The mapping approach uses data on landscape structure, land use, plant habitat indicators and occurrence of endangered species. Each parameter is registered in each 10 m x 10 m grid square as present (1) or absent (0). The decision was made not to use farming system indicators such as crop diversity or livestock density, as these variables are less permanent in time and less closely correlated with high biodiversity than the available fine-grained data on plant species richness, soil fertility, natural hydrology and presence of vulnerable species (
Other species indicators – grassland butterflies and bats
In addition to the obligatory CMEF indicator requirements, Member States are expected to use other indicators and data to monitor and assess the impacts of their agricultural policy on biodiversity. Butterflies are currently the only terrestrial insects with long-term population monitoring that allows trend calculations. Butterflies, like birds, are sensitive to environmental change. They are particularly vulnerable to habitat fragmentation and loss because some species occur in a meta-population structure, in which distinct populations exist and disperse through colonisation and extinction processes. Butterfly data complement bird data in that they use the landscape at a much finer spatial scale. The European grassland butterfly indicator is the only EU biodiversity indicator based on species abundance for an invertebrate group (
Butterfly monitoring has been carried out using comparable survey methods in 15 EU countries since 2013 (10 since 2007), and monitoring schemes are being set in up in more countries every year (
Bats are the only terrestrial group other than birds and butterflies with widespread monitoring programmes in Europe, forming a data set suitable for calculating an indicator (
Uses of biodiversity data to better target agricultural support measures: case studies
A series of case studies were carried out to identify the key aspects of the use of biodiversity data in rural development programming using literature and interviews. The interviews followed a semi-structured format, with the questions varying depending on whether the focus was on the use of biodiversity data sources for policy monitoring and evaluation, or policy targeting.
Denmark – HNV targeting framework
Denmark has recently developed its HNV indicator using an approach combining land cover, habitat distribution maps, farming system characterisation and species occurrence, as described in the previous section (
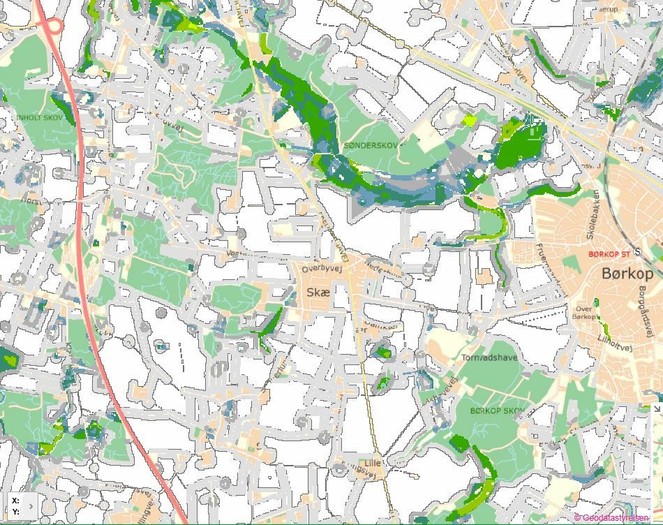
Extract of the Danish HNV map. Available at http://arealinformation.miljoeportal.dk/distribution/
All farmland within Natura 2000 is eligible for funding, but outside Natura 2000, areas of farmland are prioritized for RDP funding based on the HNV farming map by allocating funding to those applications with the highest HNV score on any square on the farm. The policy challenge faced in Denmark was that the country has 340,000 ha of habitats (wet meadows, salt meadows and marshes, dry grasslands, and heaths) that need grazing or mowing, but sufficient RDP budget to support the management of only 90,000-100,000 ha, more than half of which lies outside the Natura 2000 network of protected areas. It is therefore necessary to have a method by which management payments can be targeted to those areas of habitat that have the highest biodiversity value worth conserving. It was not possible to use satellite or aerial imaging data to map HNV in Denmark because the remaining semi-natural grasslands with high biodiversity value are in small fragmented patches on many farms, and because of the difficulty of distinguishing grasslands with high biodiversity value from remote sensing data (
UK – England - agri-environment targeting framework
In England, agri-environment-climate agreements under the new environmental land management programme 2014-2020 are awarded on a competitive basis using a national targeting framework which defines different objectives in specific areas, and scoring priorities which are ranked and defined differently in each area. England has been divided into 159 National Character Areas, which are natural subdivisions of land based on the clustering of landscape, biodiversity, geodiversity and economic activity. Maps identify priority targets for each area. Under the biodiversity objective, agriculture or forestry-related management actions are identified for a total of 19 UK priority habitats and more than 650 UK priority species*
The national targeting core technical group carried out a vast data gathering exercise in order to develop the targeting framework and select the priority species (
Some key challenges were faced in developing the targeting framework*
The data gathering exercise resulted in a biodiversity data matrix which is linked to the Land Parcel Identification System (known as the Rural Land Register) at the parcel level. Around 400 datasets were pooled into 40 data layers. The data layers were simplified and transferred into a back-end system to the Rural Land Register that assigns priorities and scores to each of the land parcels. As a result, the system is static and not directly updated from the original data layers. The integration of the data proved a challenge as the compatibility of all data layers needed to be considered. For example, some layers map areas that are suitable for actions such as afforestation to prevent flooding, but because of their lower degree of mapping precision, when these were overlain with land cover maps there were areas of anomalies indicating for example that trees should be planted in bodies of water.
The system is designed to allow applicants to see for their land parcel how well they score for particular agri-environment priorities prior to submitting their funding application. Stakeholders wanted all the data presented in a visual map format, but due to the large volume of information provided this proved to be extremely hard to interpret and read. Instead the data have been summarized within each of the areas in text form supplemented by selected spatial information. However, there is still a feeling that this format is not the optimal solution for data presentation.
The integration of the 40 data layers into the Rural Land Register has significantly expanded the capacity of the system to target environmental priorities regionally*
Czech Republic – agri-environment targeting framework and habitat and species databases
The Czech Republic Nature Conservation Agency (AOPK ČR) has assembled a biotope mapping database covering the entire territory of the state (EEA, 2014), based on a detailed habitat mapping survey (2001-2005) and an ongoing update cycle (2007-2018)*
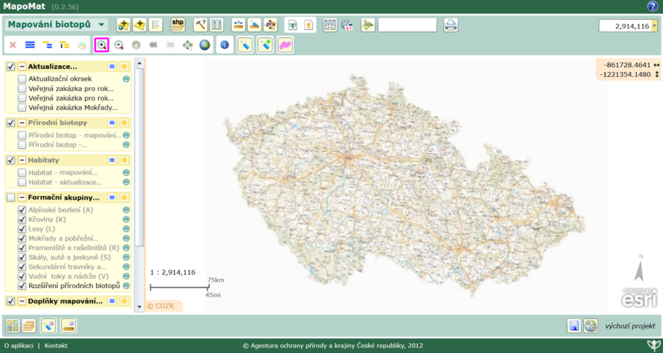
User interface of the Czech Republic biotope map. Available at http://webgis.nature.cz/
The habitats and species data were used to inform the design and targeting of agri-environment measures in the current Czech RDP 2014-2020, for example for Maculinea butterfly species and farmland bird species of high conservation priority (Lapwing Vanellus vanellus, Corncrake Crex crex)*
Estonia – semi-natural habitat targeting in collaboration between rural paying agency and Environmental Board
In Estonia regular semi-natural habitat surveying and monitoring is carried out and the semi-natural habitat data are maintained in the Nature Information System - Environmental Registry*
The habitat data from the national monitoring programme are used as background information to evaluate the impact of the Estonian rural development programme, in particular the agri-environment-climate support scheme for semi-natural habitats, but the usefulness of the dataset is limited because currently it is not possible to easily differentiate areas that have received RDP support and those that are not supported*
Slovakia – certification of grassland in LPIS using a grassland inventory
Slovakia carried out a comprehensive grassland inventory between 1998 and 2006, which mapped and processed into GIS more than 16,000 polygons*
This data system has enabled the integration of a large proportion of semi-natural grasslands into agri-environment schemes that support continued management. However, it has a number of weaknesses. The Slovak LPIS contains blocks (parcels) of very varying sizes, from the legal minimum of 0.3 ha to over 700 ha, as a legacy of the soviet system of collective farms. Even though many of these blocks are now managed in diverse ways, for example through the conversion of part of a block into arable land, the tendency of the Slovak LPIS is to further increase the block size by merging blocks*
The main challenge faced by the system is that there are currently few prospects that the grassland inventory will be updated. Although local updates are being integrated, for example as the result of the preparation of a Natura 2000 site management plan, there is no systematic updating process. Prospects for a systematic update, both in terms of funding and expert capacity, are limited, and the original inventory was already constrained by the availability of expert capacity in Slovakia, which resulted in some areas of lower quality mapping by surveyors who lacked sufficient botanical expertise*
Another challenge to maintaining a policy-relevant data system is that biological monitoring of a sample of the certified blocks in 2012 and 2016 found that many grasslands had deteriorated in quality despite the agri-environment support*
Romania – semi-natural grassland targeting
In Romania, the grassland agri-environment payments are available for all permanent grasslands identified in their Land Parcel Identification System, in order to maintain mowing or grazing within limits that prevent high levels of fertiliser application and stocking density. The payments are targeted at HNV grassland, but in fact they can be claimed for any permanent grassland, as the grassland mapping in the LPIS does not distinguish between semi-natural grassland and improved grassland. This is because the LPIS grassland layer was created under time pressure and in the absence of grassland habitat distribution data before the 2007-2013 RDP programming period*
The LPIS maps a total of 1.6 million ha of grassland and there are 240,000 beneficiaries of the payment, which shows the scale of the challenge faced by Romania in mapping and targeting its rural development support for farmland biodiversity conservation*
Romania also targets agri-environment payments at particular bird species (Corncrake Crex crex, Lesser Grey Shrike Lanius minor and Red-footed Falcon Falco vespertinus) and butterflies (Maculinea sp.) associated with semi-natural grassland. These agri-environment packages are targeted to regions that have been identified as eligible in the LPIS using species distribution data received from the Romania Lepidopteran Society and the Romanian Bird Society.
Ireland – targeting measures to farmland biodiversity despite data gaps
The first national-scale biodiversity monitoring of agri-environment scheme performance in Ireland was introduced in 2015, but at a relatively low level due to insufficient funding, and current biodiversity data are not adequate to assess the impact of agri-environment schemes*
The current Irish agri-environment programme 2014-2020 (known as the Green Low Carbon Agri-Environment Scheme GLAS) contains some measures targeted at those species and habitats for which maps are available. The GLAS includes measures targeted to a small set of bird species of conservation concern in Ireland, as defined by their threat status according to the national Red List, and which typically have restricted geographic ranges (
Conservation efforts would be improved by developing national-scale distribution maps for more habitats and species. The National Biodiversity Data Centre*
Uses of biodiversity data for assessing the impact of agri-environment schemes
Data on the abundance of common farmland birds have been used to assess the success of agri-environmental schemes in protecting biodiversity. Evaluation methods often involve statistical modelling approaches using agri-environment attributes to predict farmland bird abundances. Some examples of the use of farmland bird survey data to evaluate the impact of agricultural policies are detailed below;
- A study of the effects of implementing agri-environment schemes on French farmland bird diversity found that some grassland agri-environment measures were correlated with higher bird species richness (
Princé and Jiguet 2013 ). However, the authors make the point that it is hard to rule out the influence of selection effects, as agri-environment uptake is highest in low-intensity, high-biodiversity areas. - A study using the UK Breeding Bird Survey data for England and additional survey sites found limited evidence of positive impacts of simple agri-environment schemes (entry-level stewardship) in England (
Davey et al. 2010 ). Another study (Baker et al. 2012 ) of the impacts of individual agri-environment options on Breeding Bird Survey data found that providing winter food through the sowing of winter bird seed mixes improved the population trends of certain species, but was not sufficient to reverse national-level declines. However, other researchers suggest that breeding bird survey data may not accurately capture the effects of basic agri-environment schemes (Sage et al. 2015 ). - The effect of the Polish agri-environment programme 2007-2013 was examined by counting grassland birds on agri-environment and control parcels, within and outside SPAs, during 2013 and 2014 (
Żmihorski et al. 2016 ). General additive mixed models were used to investigate the effects of agri-environment schemes (specific to bird protection) and SPAs*33 . They found no impact of agri-environment on the species richness of birds targeted by the schemes. While the species richness of SPA-target species was not higher on SPAs, beta diversity was. The authors recommend greater targeting of agri-environment schemes to meet the needs of individual species, such as Lapwing (Vanellus vanellus) and Corncrake (Crex crex).
The butterfly data are less widely used to evaluate the impact of agri-environment schemes, but there has been an analysis using UK butterfly monitoring data. A recent study (
The results suggested that the UK agri-environment measures are associated with higher butterfly density, and the agri-environment options that specifically favour butterflies (such as tall grass field margins) were the best predictors of butterfly density (
Monitoring the impact of agri-environment schemes on biodiversity
Estonia – agri-environment monitoring programme
Estonia has monitored the impact of its RDP on biodiversity since 2004*
The biodiversity data from the arable farmland monitoring are curated by the Centre, and are shared with researchers, which has already resulted in some publications (
UK – Wales - agri-environment monitoring programme
The Welsh agri-environment scheme 2012-2020 is known as Glastir. Its environmental effects were monitored through the Glastir Monitoring and Evaluation Programme (GMEP), led by the Centre for Ecology and Hydrology, from 2012 to 2016. GMEP was a comprehensive monitoring scheme to assess the effects of Glastir against its intended outcomes, one of which is a halt of the decline of biodiversity (
GMEP resulted in a large dataset of monitoring observations available on a data portal*
It is anticipated that the successor to GMEP will form part of an integrated natural resources monitoring framework, to be phased in over the next five years. The biodiversity monitoring component will have a similar structure including a field survey informed by earth observations and model simulations*
New monitoring schemes for farmland biodiversity and monitoring proposals
Pollinator monitoring in the UK
There is currently no systematic monitoring of pollinators anywhere in the EU. Nonetheless, there is growing evidence that pollinators (bees, hoverflies, and butterflies) are declining in the EU from studies that have analysed records of species occurrence in various EU countries (
In the UK, a proposal for a systematic national wild pollinator monitoring scheme has been developed (
Proposals for EU-wide farmland biodiversity monitoring
The European Commission is providing some funding for the establishment of an EU-wide monitoring programme of farmland biodiversity*
The BioBio project (
A survey in 2014 gathered baseline data on biodiversity and landscape features in arable farmland across the EU. The survey sampled data from about 800 plots each of 25 ha in size in 39 regions of 10 European countries. It was repeated in summer 2016. The survey team proposes the methodology as a suitable model for ongoing EU-wide monitoring of arable farmland (
Improving biodiversity data use for implementing and assessing agricultural policy
Biodiversity data are essential for two key processes within the rural development planning cycle, firstly policy targeting and secondly evaluation. This study has identified a number of examples of good practice in the use of biodiversity data for each of these policy processes, and also highlighted some current weaknesses and barriers.
Improving policy targeting with biodiversity data
Targeting agri-environment measures and other rural development payments at farmland that already contains some species and habitats of conservation value is important, because it has been shown that measures that are designed to protect particular species and habitats can be much more effective and efficient for conservation than untargeted measures (
It is important to distinguish between data and tools that are intended for the purposes of monitoring biodiversity under the CMEF requirement, and data and tools that are intended for targeting policy instruments at biodiversity. Although the data and tools used for these two purposes may sometimes overlap, it is important to be clear from the start of any data collection work that the technical requirements are different. For example, monitoring can be achieved through sample surveys whereas effective targeting of support measures cannot. Conversely, a map designed for targeting support at certain species or habitats may be unsuitable for monitoring changes in species or habitat distribution or conservation status.
Improving policy monitoring and evaluation with biodiversity data
Policy monitoring and evaluation requires the use of data and indicators that measure impact. The Common Monitoring and Evaluation Framework of the CAP requires the use of indicators of biodiversity based on the common farmland bird index, the conservation status of grasslands, and HNV farmland. The CMEF bird and grassland indicators use biodiversity datasets and methodologies that follow a common EU-wide approach, and that have sufficient data to measure progress in biodiversity conservation over time at the national level. However, neither indicator as presented in RDPs gives sufficient information to allow an assessment of actual impacts on biodiversity in the absence of supporting information and analysis, as the indicators are simply a number, sometimes with a trend graph.
The grassland CMEF indicator, for example, is only defined as measuring the conservation status of the grassland habitats, and presents the data only as the percentage of assessments of habitats in 2013 which are in favourable, unfavourable – inadequate, unfavourable – bad, and unknown status. This information gives no indication of the total area of habitat in question, as the assessments are undertaken at the biogeographical region level within Member States, with habitat areas ranging from a few square kilometres to tens of thousands of square kilometres. The data on the actual area in each conservation status category could be used to show how much land needs to be targeted by RDP measures and what proportion of total grassland area is species rich. Unless the RDPs include a more in-depth discussion of the habitat survey data available at the national level and what policy needs to deliver to make a change, the indicator is of limited usefulness. Analysts of the Irish RDP concluded that the indicator has not been taken seriously by the agricultural ministry in Ireland and is of little practical use in measuring impacts on species-rich grassland (
The Common Farmland Bird Index does not necessarily reflect the trends in all farmland species, as an increase in the index could indicate an increase in some species but a decline in others. For example, generalist species outcompeting specialists has been shown to be a likely outcome of habitat fragmentation (
The HNV indicator is potentially a valuable tool for integrated monitoring of the nature value of farmland, or for the targeting of RDP support to farmland with high potential to support biodiversity. The indicator is intended to combine measures of semi-natural habitat on farmland, farmland species of conservation concern, and diverse landscape structures that support high levels of biodiversity. However, few countries have assembled the required data to accurately map HNV at the farm parcel level in a consistent, comprehensive and up-to-date form, although many have partial data that could be completed (
HNV mapping approaches do not currently allow the assessment of pressures that may be driving the changes, but if farm data on management practices (such as fertiliser use and stocking densities) from the IACS database of all farms receiving CAP payments could be included it would be possible to evaluate the impacts of CAP funding on HNV quality of the agricultural landscape (
Assessing impacts on biodiversity requires strong links between monitoring, ongoing evaluation and impact evaluation over the whole programme implementation period. With respect to biodiversity, this should ideally be based on a coherent biodiversity data management system and monitoring framework, together with process steering and appropriate methodologies and instruments. The lack of such a data collection and management system is one of the key barriers to the effective use of biodiversity data to inform agricultural policy (see Fig.
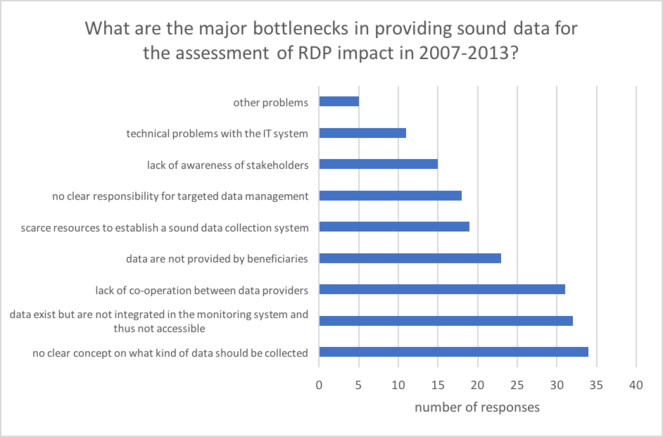
Opinions of RDP policy evaluators on data availability and bottlenecks. Results reproduced from
A group of 58 RDP policy evaluators were asked about data availability and bottlenecks to data use for agricultural policy impact evaluation in 2007-2013. In response to the question: “To what extent are sound data available to carry out RDP impact evaluations?” 2% (1) replied ‘fully available’, 24% (14) replied ‘largely available’, 72% (42) replied ‘partly available’, 2% (1) replied ‘not available’. The answers to the question “What are the major bottlenecks in providing sound data for the assessment of RDP impact in 2007-2013?” are shown in the graph.
Assessing the impact of individual measures, for example an agri-environment scheme, requires population monitoring surveys of target species and habitats, in order to monitor and evaluate impact in the target areas with comparable data from non-target areas as a control (i.e. to assess the counterfactual). This requires a planned and targeted monitoring programme designed specifically for monitoring the impact of the identified measures. This study has described the nationally structured systematic monitoring programmes to measure the impact on biodiversity of agri-environment measures in Wales and Estonia, and showed how these are being used to improve the effectiveness of rural development funding for biodiversity conservation.
A recent report carried out an EU-wide analysis of the relationship between agricultural land use and biodiversity, for which the authors compiled a database of biodiversity data sources and identified the obstacles encountered in the use of biodiversity data (
Studies exploring the effects of agri-environment schemes on biodiversity may choose to perform their own surveys rather than utilising the farmland bird indicator dataset, due to barriers to use of monitoring datasets. The national monitoring schemes may not contain sufficient samples from sites with a particular agri-environment scheme to allow for an evaluation using the data, as the method of stratified random site selection employed in most national schemes may result in insufficient samples of protected area or agri-environment scheme sites. In addition, the 1 km2 scale employed by the PECBMS and ECBMS may not be appropriate for assessing the impact of small agri-environment features. It should also be borne in mind that the national breeding bird surveys do not effectively monitor rare or threatened birds (and are not designed to do so). A proposed rare bird index would provide information on the endangered species which are often targets of agri-environment schemes (
Prospects for biodiversity monitoring and data use to inform agricultural policy
The examples in this study show the possibilities for better targeting and evaluation of agricultural funding to biodiversity conservation if sufficient biodiversity data are available and are used in policy. For example, the Danish HNV targeting framework uses available fine-grained data on plant species richness, soil fertility, natural hydrology and presence of vulnerable species rather than farming system indicators such as crop diversity or livestock density, as these variables are less permanent in time and less closely correlated with high biodiversity (
The examples described in this study are producing large datasets on agricultural biodiversity that could be used in further analyses to inform policy. For example, German HNV farmland monitoring is producing a valuable database of farmland habitat distributions with a high potential for informing research to deliver a better understanding of the changes in farmland biodiversity (
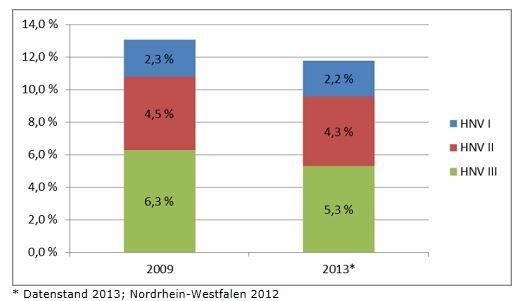
The German HNV monitoring methodology and results - HNV value decline
In Germany, the HNV monitoring methodology has enabled an initial assessment of the trend in HNV value of farmland. Between 2009 and 2013, there was a significant decline of HNV value, in particular in the HNV class III, which represents the lowest value (in terms of species richness and structure). Graph reproduced from (
The movement towards the digitisation and aggregation of biodiversity records is increasing the accessibility of high quality biodiversity data for analysis held by specialist organisations, individual experts or local recording centres which has not always been freely accessible for policy monitoring. For example, in the UK the National Biodiversity Network partnership provides access to rapidly increasing collections of data on biodiversity, although the number of publicly accessible records available at fine spatial scales is still low (Fig.
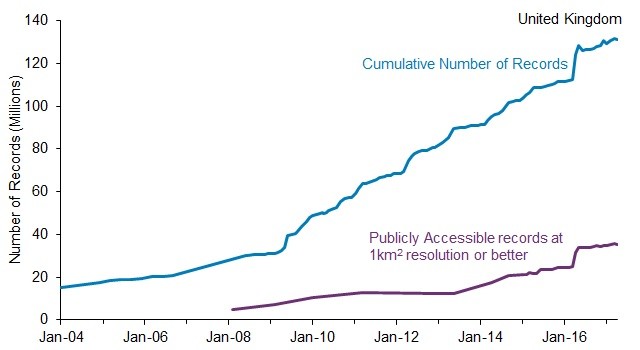
Records added to the National Biodiversity Network Gateway, 2004 to 2015. From UK Biodiversity Indicators 2015, http://jncc.defra.gov.uk/page-4229 Source: NBN Gateway and NBN Atlas.
One key development in the improvement of biodiversity data provision and integration is the European Biodiversity Observation Network (EU BON), which has produced a suite of tools including the European Biodiversity Portal (http://biodiversity.eubon.eu/). This is a gateway to biodiversity datasets and allows population trend visualisation, drawing on data from sources such as the Global Biodiversity Information Facility. As such, it could be used as a decision support tool for informing rural development policies. EU data sources on farmland species and relevant agricultural data have been identified and summarised in a meta-database for the European Commission as part of a recent study (
Systematic EU wide monitoring programmes are being developed for butterflies and pollinators. Monitoring pollinators is more challenging than birds, because there are many more species, most of these cannot be identified to species in the field so capture of specimens becomes necessary, there are comparatively few volunteer recorders or citizen science initiatives focussed on pollinating insects, and identification of collected specimens is time-consuming and requires specialist skills (
In future, species-rich grassland monitoring at the EU level will be improved by the planned new LUCAS grassland survey methodology, which will be available from the 2021 LUCAS survey onwards*
In summary, there is an urgent need for increased and better use of biodiversity data in supporting CAP measures, especially rural development programmes, that aim to conserve semi-natural habitats and species associated with farming. Recommendations for the improved use of biodiversity data for agricultural policy include the improvement of datasets of semi-natural grasslands; the establishment of sample surveys of semi-natural grassland condition; the systematic transect monitoring of butterflies, alongside continued monitoring of farmland birds. This needs to be supported by more comprehensive and finer grained (ideally field scale) data on agricultural systems and practice.
Acknowledgements
We thank the following for the interviews carried out for the study:
- Clive Porro, Natural England, England, UK, December 2015
- Razvan Popa, Fundatia Adept, Romania, 14 December 2016
- Nicholas Barbara, Birdlife Malta, Malta, 16 December 2016
- Eneli Viik & Iiri Raa, Agricultural Research Centre, Estonia, 21 December 2016
- Daire Ó hUallacháin, Teagasc - The Agriculture and Food Development Authority, Ireland, 5 January 2017
- Bronwen Williams, Centre for Ecology & Hydrology (Bangor), Wales, UK, 10 January 2017
- Iva Hönigová & Karel Chobot, Nature Conservation Agency (AOPK), Czech Republic, 11 January 2017
- Klara Čamska, Nature Conservation Agency (AOPK), Czech Republic, 11 January 2017
- Dobromil Galvanek, Independent consultant (previously at Daphne), Slovakia, 12 January 2017
- Jesper Bladt, Aarhus University, Denmark, 20 January 2017
We thank Katie Taylor for her work on the England case study example. We acknowledge the helpful review comments from IEEP colleagues and from Angela Lomba, CIBIO Centro de Investigação em Biodiversidade e Recursos Genéticos, Universidade do Porto, Portugal.
Funding program
This paper was supported by the EU BON project which is a European Union’s Seventh Framework Programme for Research and Technical Development under grant agreement No 308454.
Grant title
EU BON - Building the European Biodiversity Observation Network
Hosting institution
Institute for European Environmental Policy (IEEP)
References
-
How High Nature Value (HNV) farmland is related to bird diversity in agro-ecosystems – Towards a versatile tool for biodiversity monitoring and conservation planning.Agriculture, Ecosystems & Environment194:58‑64. https://doi.org/10.1016/j.agee.2014.04.012
-
Landscape-scale responses of birds to agri-environment management: a test of the English Environmental Stewardship scheme.Journal of Applied Ecology49(4):871‑882. https://doi.org/10.1111/j.1365-2664.2012.02161.x
-
Weiterentwicklung des Agrar-Umweltindikators "High Nature Value Farmland" für Österreich.Umweltbundesamt,Wien. URL: http://www.umweltbundesamt.at/fileadmin/site/publikationen/REP0348.pdf
-
The role of agri-environment schemes in conservation and environmental management.Conservation Biology29(4):1006‑1016. https://doi.org/10.1111/cobi.12536
-
The Application of the High Nature Value Indicator 2007-2013.European Evaluation Network for Rural Development,Brussels. URL: http://enrd.ec.europa.eu/enrd-static/fms/pdf/6A6CD2B6-A815-CFBE-2CC4-DCEC94DAD070.pdf
-
HNV farming in England and Wales - findings from three local projects.EFNCP,UK.
-
Monitoring and first results of High Nature Value Farmland Monitoring in Germany: evidence of ongoing biodiversity loss within agricultural landscapes.Natur & Landschaft90(7):309‑316. URL: https://www.kohlhammer.de/wms/instances/KOB/appDE/Natur-und-Landschaft-fuer-freies-Einkaufen/Methodik-und-erste-Ergebnisse-des-Monitorings-der-Landwirtschaftsflaechen-mit-hohem-Naturwert-in-Deutschland/
-
High Nature Value (HNV) in Denmark: Targeting biodiversity.Presentation at the DG AGRI Unit 3.4 HNV Good Practice workshop,June 7-8 2016, Bonn, Germany. URL: https://enrd.ec.europa.eu/sites/enrd/files/gpw-02_4-4_denmark_bladt_brink.pdf
-
Development and implementation of a high nature value (HNV) farming indicator for Denmark.Ecological Indicators61:274‑281. https://doi.org/10.1016/j.ecolind.2015.09.027
-
Design and Testing of a National Pollinator and Pollination Monitoring Framework.Centre for Ecology & HydrologyURL: http://randd.defra.gov.uk/Default.aspx?Menu=Menu&Module=More&Location=None&ProjectID=19259
-
Evidence for habitat and climatic specializations driving the long-term distribution trends of UK and Irish bumblebees.Diversity and Distributions21(8):864‑875. https://doi.org/10.1111/ddi.12344
-
Agri-environmental evaluation in Ireland, with special reference to skylark.BOU Proceedings - Lowland Farmland Birds III.British Ornithology Union,UK. URL: http://www.bou.org.uk/bouproc-net/lfb3/copland-etal.pdf
-
Estimates and trends of common breeding birds in the Republic of Ireland.Irish Birds10:23‑32. URL: http://www.birdwatchireland.ie/LinkClick.aspx?fileticket=zwD8V1q3gm0%3d&tabid=280
-
Konzept für ein Biodiversitätsmonitoring Landwirtschaft in Deutschland.Thünen Institut,Braunschweig, Germany. URL: https://www.thuenen.de/media/publikationen/thuenen-workingpaper/ThuenenWorkingPaper_58.pdf
-
Assessing the impact of Entry Level Stewardship on lowland birds in England.Ibis152(3):459‑474. https://doi.org/10.1111/j.1474-919X.2009.01001.x
-
Evaluating the impact of rural development measures on nature value indicators at different spatial scales: Application to France and The Netherlands.Ecological Indicators59:41‑61. https://doi.org/10.1016/j.ecolind.2014.12.014
-
Distribution of specialist and generalist species along spatial gradients of habitat disturbance and fragmentation.Oikos117(4):507‑514. https://doi.org/10.1111/j.0030-1299.2008.16215.x
-
How much flower-rich habitat is enough for wild pollinators? Answering a key policy question with incomplete knowledge.Ecological Entomology40(S1):22‑35. https://doi.org/10.1111/een.12226
-
Low-intensity agriculture increases farmland bird abundances in France.Journal of Applied Ecology47(6):1348‑1356. https://doi.org/10.1111/j.1365-2664.2010.01869.x
-
Quantitative historical change in bumblebee (Bombus spp.) assemblages of red clover fields.PLoS ONE6(9): . https://doi.org/10.1371/journal.pone.0025172
-
Streamlining European biodiversity indicators 2020: Building a future on lessons learnt from the SEBI 2010 process.European Environment Agency,Copenhagen. URL: http://www.eea.europa.eu/publications/streamlining-european-biodiversity-indicators-2020
-
The European Grassland Butterfly Indicator: 1990-2011.European Environment Agency,Copenhagen. URL: http://www.eea.europa.eu/publications/the-european-grassland-butterfly-indicator-19902011
-
Terrestrial habitat mapping in Europe: an overview.European Environment Agency,Copenhagen. URL: http://www.eea.europa.eu/publications/terrestrial-habitat-mapping-in-europe
-
Glastir Monitoring & Evaluation Programme. Final Report to Welsh Government.NERC/Centre for Ecology & Hydrology (CEH Projects: NEC04780/NEC05371/NEC05782),Gwynedd, Wales. URL: https://gmep.wales/resources
-
Targeted data management for evidence-based evaluation in rural development.Newsletter of the Good Practice Workshop "Targeted data management for evidence-based evaluation in Rural Development",Budapest, Hungary – 8 & 9 October 2012,2012.European Network for Rural DevelopmentURL: https://enrd.ec.europa.eu/en/evaluation/good-practices-workshops/targeted-data-management-for-evidence-based-evaluation-in-rd
-
Specific challenges in using common rural development indicators at regional level.Good Practice Workshop,Brussels,2013.European Network for Rural DevelopmentURL: https://enrd.ec.europa.eu/en/evaluation/good-practices-workshops/common-rural-development-indicators-at-regional-level
-
Article 17 web tool on biogeographical assessments of conservation status of species and habitats under Article 17 of the Habitats Directive.2015.European Topic Centre on BiodiversityURL: http://bd.eionet.europa.eu/article17/reports2012/
-
Farming for Natura 2000. Guidance on how to integrate Natura 2000 conservation objectives into farming practices based on Member States good practice experiences.European Commission,Brussels. URL: http://ec.europa.eu/environment/nature/natura2000/management/docs/FARMING%20FOR%20NATURA%202000-final%20guidance.pdf
-
Technical handbook on the monitoring and evaluation framework of the Common Agricultural Policy 2014-2020.European Commission DG for Agriculture and Rural Development,Brussels. URL: http://ec.europa.eu/agriculture/cap-post-2013/monitoring-evaluation/index_en.htm
-
Preparing the assessment of High Nature Value farming in RDPs 2014-2020: Practices and solutions.European Evaluation Helpdesk for Rural Development,Brussels. URL: http://enrd.ec.europa.eu/sites/enrd/files/gpw_2_hnv_report.pdf
-
Practices to identify, monitor and assess HNV farming in RDPs 2014-2020.European Evaluation Helpdesk for Rural Development, European Commission DG AGRI Unit 3.4URL: http://enrd.ec.europa.eu/evaluation/publications/practices-identify-monitor-and-assess-hnv-farming-rdps-2014-2020_en
-
European Vegetation Archive EVA.European Vegetation Survey Dataset. URL: http://euroveg.org/eva-database
-
Country report on the implementation of the new CAP and its possible effects on permanent pastures: Ireland.European Forum on Nature Conservation and Pastoralism,Lampeter, UK. URL: http://www.efncp.org/download/IrelandCAPandpermanentpasturesimplementation.pdf
-
Integration of semi-natural grasslands on LPIS making for improved policy delivery in Slovakia: successes and challenges.EFNCP. URL: http://www.efncp.org/download/semi-natural-pastueres-meadows2012/Galvanek.pdf
-
How much would it cost to monitor farmland biodiversity in Europe?Journal of Applied Ecology53(1):140‑149. https://doi.org/10.1111/1365-2664.12552
-
Wild bird indicators: using composite population trends of birds as measures of environmental health.Ornithological Science9(1):3‑22. https://doi.org/10.2326/osj.9.3
-
Using birds as indicators of biodiversity.Ornis Hungarica12-13:11‑24. URL: http://www.ebcc.info/wpimages/other/bio-iindicators.pdf
-
Developing indicators for European birds.Philosophical Transactions of the Royal Society B: Biological Sciences360(1454):269‑288. https://doi.org/10.1098/rstb.2004.1602
-
Which habitats of European importance depend on agricultural practices?Biodiversity and Conservation20(11):2365‑2378. https://doi.org/10.1007/s10531-011-9989-z
-
European bat population trends: A prototype biodiversity indicator.European Environment Agency,Copenhagen. URL: http://www.eea.europa.eu/publications/european-bat-population-trends-2013
-
Landscape infrastructure and sustainable agriculture (LISA): Report on the investigation in 2014.Institute for Agroecology and Biodiversity (IFAB) supported by INEA, jKi, Gregor Louisoder Umweltstiftung, EEB,Germany. URL: http://www.eeb.org/index.cfm?LinkServID=0E2EEC07-5056-B741-DBA777455AA46334
-
Carpe noctem: the importance of bats as bioindicators.Endangered Species Research8(1-2):93‑115. https://doi.org/10.3354/esr00182
-
High Nature Value farming throughout EU-27 and its financial support under the CAP.Institute for European Environmental Policy & European Forum on Nature Conservation and Pastoralism,London. URL: http://ec.europa.eu/environment/agriculture/pdf/High%20Nature%20Value%20farming.pdf
-
The decline of the bumble bees and cuckoo bees (Hymenoptera: Apidae: Bombini) of Western and Central Europe.Oryx41(01):79‑88. https://doi.org/10.1017/S0030605307001597
-
Reconciling nature conservation and traditional farming practices: a spatially explicit framework to assess the extent of High Nature Value farmlands in the European countryside.Ecology and Evolution5(5):1031‑1044. https://doi.org/10.1002/ece3.1415
-
Mapping and monitoring High Nature Value farmlands: Challenges in European landscapes.Journal of Environmental Management143:140‑150. https://doi.org/10.1016/j.jenvman.2014.04.029
-
Making the best of both worlds: Can high-resolution agricultural administrative data support the assessment of High Nature Value farmlands across Europe?Ecological Indicators72:118‑130. https://doi.org/10.1016/j.ecolind.2016.08.008
-
Environmentally friendly management as an intermediate strategy between organic and conventional agriculture to support biodiversity.Biological Conservation178:146‑154. https://doi.org/10.1016/j.biocon.2014.08.005
-
Predicted distribution of High Nature Value farmland in the Republic of Ireland.Journal of Maps1‑4. URL: http://www.tandfonline.com/doi/abs/10.1080/17445647.2016.1223761?journalCode=tjom20
-
Birds as useful indicators of high nature value (HNV) farmland in Central Italy.Ecological Indicators38:236‑242. https://doi.org/10.1016/j.ecolind.2013.11.016
-
Assessment of the effect of Environmental Stewardship on improving the ecological status of grassland, moorland and heath.Natural England,England. URL: http://publications.naturalengland.org.uk/publication/5163836952805376
-
The effects of field size on the number of bumblebees.Agronomy Research8(Special Issue II):357‑360. URL: http://agronomy.emu.ee/vol08Spec2/p08s209.pdf
-
Section 41 Species - Priority Actions Needed (B2020-008). URL: http://publications.naturalengland.org.uk/publication/4958719460769792
-
Potential habitat creation and restoration by National Character Area (NCA) (B2020-003). URL: http://publications.naturalengland.org.uk/publication/4787624740913152?category=6074729802760192
-
Research recommendations of the Agriculture, Grasslands and Soil Working Group of the National Platform for Biodiversity Research.National Platform for Biodiversity Research,February 2012, Ireland. URL: http://www.botanicalenvironmental.com/wp-content/uploads/2014/02/NPBR_recomm_combined.pdf
-
Evaluating the Breeding Bird Survey for producing national population size and density estimates.Bird Study52(1):42‑54. https://doi.org/10.1080/00063650509461373
-
Assessment of the effects of Environmental Stewardship on landscape character.Natural England,England. URL: http://publications.naturalengland.org.uk/publication/6030120045248512
-
Opportunities within the revised EU Common Agricultural Policy to address the decline of farmland birds: an Irish perspective.Diversity7:307‑317. https://doi.org/10.3390/d7030307
-
Assessing the importance of spatial location of agri environment options within the landscape to butterflies.Natural England,UK. URL: http://publications.naturalengland.org.uk/publication/5487886094827520
-
Extinctions of aculeate pollinators in Britain and the role of large-scale agricultural changes.Science346(6215):1360‑1362. https://doi.org/10.1126/science.1257259
-
The Irish semi-natural grasslands survey 2007-2012.National Parks and Wildlife Service, Department of Arts, Heritage and the Gaeltacht,Ireland. URL: http://www.npws.ie/sites/default/files/publications/pdf/IWM-78-Irish-semi-natural-grassland-survey.pdf
-
High Nature Value Farming in Europe. 35 European Countries - Experiences and Perspectives.verlag regionalkultur,Ubstadt-Weiher. URL: http://www.efncp.org/publications/books/ [ISBN978-3-89735-657-3]
-
Quantifying effects of changed farm practices on biodiversity in policy impact assessment – an application of CAPRI-Spat.OECD,Paris. URL: http://www.oecd.org/tad/sustainable-agriculture/44802327.pdf
-
Mitigating the impacts of agriculture on biodiversity: bats and their potential role as bioindicators.Mammalian Biology - Zeitschrift für Säugetierkunde80(3):191‑204. https://doi.org/10.1016/j.mambio.2014.10.004
-
The challenge of environmental monitoring: the example of HNV farmland.http://purl.umn.edu/99586.European Association of Agricultural Economists 122nd Seminar, February 17-18, 2011,Ancona, Italy.AgEconSearchURL: http://ageconsearch.umn.edu/bitstream/99586/2/peppiette.pdf
-
Targeting agri-environment schemes for farmland birds in England.BOU Proceedings - Lowland Farmland Birds III.British Ornithology Union,UK. URL: http://www.bou.org.uk/bouproc-net/lfb3/phillips-etal.pdf
-
Analysis of spatial and temporal variations of High Nature Value farmland and links with changes in bird populations: a study on France.Publications Office of the European Union,Luxembourg. https://doi.org/10.2788/79127
-
Identification of High Nature Value farmland in France through statistical information and farm practice surveys.Office for Official Publications of the European Communities,Luxembourg. URL: http://agrienv.jrc.ec.europa.eu/publications/pdfs/JRC_HNV_France.pdf
-
Monitoring Butterflies for Ecology and Conservation.Springer,London. URL: https://books.google.co.uk/books?hl=en&lr=&id=7UuMTGUL3vMC&oi=fnd&pg=PR9&dq=+Monitoring+Butterflies+for+Ecology+and+Conservation&ots=KC30PPDLIN&sig=6e4tuDopH5KU7fyq4pl1NxKbKyE#v=onepage&q=Monitoring%20Butterflies%20for%20Ecology%20and%20Conservation&f=false
-
Ecological effectiveness of French grassland agri-environment schemes for farmland bird communities.Journal of Environmental Management121:110‑116. https://doi.org/10.1016/j.jenvman.2013.02.039
-
Satellite remote sensing to monitor species diversity: potential and pitfalls.Remote Sensing in Ecology and Conservationhttps://doi.org/10.1002/rse2.9
-
Using fledged brood counts of hedgerow birds to assess the effect of summer agri-environment scheme options.Ecological Indicators57:376‑383. https://doi.org/10.1016/j.ecolind.2015.04.041
-
Monitoring of plants and habitats of Community interest in the Slovak Republic, Results and assessment in the period of 2013 – 2015.Banská Bystrica: State Nature Conservancy of the Slovak RepublicURL: http://www.daphne.sk/en/content/publik%C3%A1cie-na-stiahnutie [ISBNISBN 978-80-8184-023-4]
-
Service contract to support follow-up actions to the mid-term review of the EU biodiversity strategy to 2020 in relation to target 3A – Agriculture.Report to the European Commission, Institute for European Environmental Policy (unpublished),London.
-
Development and application of new methodological frameworks for the evaluation of environmental impacts of rural development programmes in the EU.ENVIEVAL project Deliverable D2.1 Summary report on the review of indicator sets and monitoring approachesURL: http://www.envieval.eu/fileadmin/envieval/dissemination/deliverables/D2_1_final_revised_May_2014.pdf
-
NELMS Local Validation Issues paper. URL: http://slnp.org.uk/wp-content/uploads/2014/11/NELMS-Local-Validation-Issues-paper-final.docx
-
NELMs national targeting framework. URL: http://slnp.org.uk/wp-content/uploads/2014/11/NELMS-Targeting-Framework-October-2014-final.doc
-
Identification of high nature value grassland with remote sensing and minimal field data.Ecological Indicators74:28‑38. https://doi.org/10.1016/j.ecolind.2016.11.005
-
Estimating the cost of different strategies for measuring farmland biodiversity: Evidence from a Europe-wide field evaluation.Ecological Indicators45:434‑443. https://doi.org/10.1016/j.ecolind.2014.04.050
-
The European Butterfly Indicator for Grassland species: 1990-2015.Butterfly Conservation Europe / De Vlinderstichting,Wageningen, The Netherlands. https://doi.org/10.13140/RG.2.2.31912.37127
-
Estonian case study – Evaluation of agri-environment schemes’ biodiversity objective.Presentation to Good Practice Workshop: Assessing environmental effects of Rural Development Programmes,Brussels November 2015.European Network for Rural DevelopmentURL: http://enrd.ec.europa.eu/sites/enrd/files/fs-006-ee-biodiversity.pdf
-
How can the Rural Development Programme’s agri-environmental payments be improved? Experiences from other countries.Jordbruksverket,Sweden. URL: http://www2.jordbruksverket.se/webdav/files/SJV/trycksaker/Pdf_rapporter/ra13_21.pdf
-
Characterizing grassland vegetation with full-waveform airborne laser scanning: a feasibility study for detecting Natura 2000 habitat types.Remote Sensing6(9):8056‑8087. https://doi.org/10.3390/rs6098056
-
Evaluating conservation tools in Polish grasslands: The occurrence of birds in relation to agri-environment schemes and Natura 2000 areas.Biological Conservation194:150‑157. https://doi.org/10.1016/j.biocon.2015.12.007
Supplementary material
The supplementary material provides additional detail on methods and data sources used in the case studies and examples that are describe in the main article.
Download file (415.23 kb)
Regulation (EU) No 1305/2013 Preamble paragraph (24) and Commission Implementing Regulation (EU) No 808/2014 Annex I 4(b) (http://eur-lex.europa.eu/legal-content/en/TXT/?uri=CELEX:32014R0808)
Regulation (EU) No 1306/2013 available at http://eur-lex.europa.eu/legal-content/en/ALL/?uri=CELEX%3A32013R1306
Annex VI in Commission Implementing Regulation (EU) No 808/2014 of 17 July 2014 laying down rules for the application of Regulation (EU) No 1305/2013 of the European Parliament and of the Council on support for rural development by the European Agricultural Fund for Rural Development (EAFRD) (http://eur-lex.europa.eu/legal-content/en/TXT/?uri=CELEX:32014R0808)
Proposed by the Commission in COM(2006) 508 and then approved by the Agriculture Council. The IRENA project has been stopped, and the IRENA indicator set is no longer being updated by the EEA. EuroStat is continuing to update some of the indicators in an adapted form, see http://ec.europa.eu/eurostat/web/agri-environmental-indicators/indicators
European Bird Census Council. http://www.ebcc.info/index.php?ID=616
Ongoing project of European Environment Agency and Alterra
Skylark is negatively correlated with hedgerow presence and Greenfinch prefers forest patches, which are present only marginally in the HNV farmland and more present in urban areas.
Personal communication, Maria-Luisa Paracchini, Joint Research Centre, 12 June 2017
Personal communication, Jesper Bladt, Aarhus University, 20 January 2017
The England lists of 56 priority habitats and 943 priority species are published according to Section 41 (S41) and detailed in Section 42 of the Natural Environment and Rural Communities (NERC) Act 2006 (available at http://www.legislation.gov.uk/ukpga/2006/16/contents). In Wales, Section 7 of the 2016 Environment Act (Wales) replaces Section 42 of the 2006 NERC Act (available at http://gov.wales/topics/environmentcountryside/consmanagement/natural-resources-management/environment-act/?lang=en).
The Bird Conservation Targeting Project is a joint Natural England, RSPB, BTO and Forest Commission initiative which works closely together with BirdTrack (www.birdtrack.net), a partnership between the BTO, the RSPB and BirdWatch Ireland, with the aim of automating the process of collating bird records. Local bird clubs and individuals are encouraged to share their bird data in BirdTrack and/or the National Biodiversity Network, and efforts are ongoing to integrate BirdTrack with the NBN web services.
Issues DEFRA encountered as per personal communication with Clive Porro (December, 2015)
A few weaknesses still create obstacles to smooth administration of contracts; for example, agri-environment applications need to be processed before land use changes are registered in the system, as this is only done once a year, so a landowner could apply for an arable agri-environment option on a land parcel that is still registered as temporary grassland in the system. Personal communication with Clive Porro December 2015.
Personal communication, Karel Chobot & Iva Hönigová, Nature Conservation Agency (AOPK), 11 January 2017
Personal communication, Klara Čamska, Nature Conservation Agency (AOPK), 11 January 2017
Regular semi-natural habitat surveying and monitoring is carried out in the Estonian national environmental monitoring program. The Estonian Nature Information System-Environmental Registry contains the most up to date habitat information, however it is mostly restricted to semi-natural areas located in the Natura 2000 network. Available at http://register.keskkonnainfo.ee/envreg/main#HTTPim5RXcIcpOHb7wTQbTgFhPK8rr6tcZ
Personal communication, Eneli Viik, Agricultural Research Centre Estonia, 21 December 2016
Derived from vector maps at a 1:25 000 scale
Called Banská Bystrica. Until 2007 the verification and certification process was carried out by Daphne. The GIS is updated by the Institute of Soil Science.
Personal communication, Dobromil Galvanek, independent consultant, 12 January 2017
In Slovakia, the eligibility criteria for direct payments under Pillar 1 and Pillar 2 payments are the same, so all farmers who receive agri-environment payments are also eligible for direct payments. Restoration takes place only when farmers invest their own resources to clear vegetation or when other funding sources are accessed by protected area authorities, NGOs, etc.
Personal communication, Razvan Popa, Director of Fundatia Adept, 14 December 2016
This is the lowest level of administration (ie LAU level) in Romania, typically representing an area with a few villages and up to 10,000 inhabitants.
Personal communication, Daire Ó hUallacháin, Teagasc, 5 January 2017
The Polish RDP has restricted the implementation of agri-environment schemes targeted at birds to parcels within SPAs. See Poland RDP 2014-2020 http://www.minrol.gov.pl/Wsparcie-rolnictwa/Program-Rozwoju-Obszarow-Wiejskich-2014-2020
As the agri-environment scheme for environmentally friendly management and the organic farming support for 2014-2020 are similar to the previous period, the biodiversity monitoring scheme is continuing in a similar format to the monitoring up to 2015, with a slightly changed sample of farms.
The Centre had planned to provide data access via a web platform but this was abandoned due to lack of funding. Personal communication, Eneli Viik, Agricultural Research Centre Estonia, 21 December 2016.
Personal communication, Bronwen Williams, CEH Bangor, 10 January 2017.
Tender ENV.D.2/SER/2016/0058MV available at http://ec.europa.eu/environment/funding/calls_en.htm
There are currently approximately 10.8 million agricultural holdings in the EU. Eurostat statistics http://ec.europa.eu/eurostat/statistics-explained/index.php/Farm_structure_statistics.
On p36 in Malta RDP 2014-2020 available at https://eufunds.gov.mt/en/EU%20Funds%20Programmes/European%20Agricultural%20Fund/Documents/RDP%202014-2020/Malta%27s%20Rural%20Development%20Programme%202014-2020.pdf
Personal communication, Nicholas Barbara, BirdLife Malta, 16 December 2016
Certain AECM options (e.g. management of mesic and slightly wet meadows, dry and mountain meadows) are available only inside protected areas (Landscape Protected Areas, National Parks and their buffer zones, and Natura 2000 sites).