|
Research Ideas and Outcomes :
Software Description
|
|
Corresponding author: Martin Palma (martin.palma@eurac.edu)
Received: 29 Jan 2021 | Published: 29 Mar 2021
© 2021 Martin Palma, Alessandro Zandonai, Luca Cattani, Johannes Klotz, Giulio Genova, Christian Brida, Norbert Andreatta, Georg Niedrist, Stefano Della Chiesa
This is an open access article distributed under the terms of the Creative Commons Attribution License (CC BY 4.0), which permits unrestricted use, distribution, and reproduction in any medium, provided the original author and source are credited.
Citation:
Palma M, Zandonai A, Cattani L, Klotz J, Genova G, Brida C, Andreatta N, Niedrist G, Della Chiesa S (2021) Data Browser Matsch | Mazia: Web Application to access microclimatic time series of an ecological research site. Research Ideas and Outcomes 7: e63748. https://doi.org/10.3897/rio.7.e63748
|
|
Abstract
Background
Easily accessible data is an essential requirement for scientific data analysis. The Data Browser Matsch | Mazia was designed to provide a fast and comprehensible solution to access, visualize and download the microclimatic measurements of the IT 25 LT(S)ER Match | Mazia research site in South Tyrol, Northern Italy, with the overall aim to provide straightforward data accessibility and enhance dissemination.
New information
Data Browser Matsch | Mazia is a user-friendly web-based application to visualize and download micrometeorological and biophysical time series of the Long-Term Socio-Ecological Research site Matsch | Mazia in South Tyrol, Italy. It is designed both for the general public and researchers. The Data Browser Matsch | Mazia drop-down menus allow the user to query the InfluxDB database in the backend by selecting the measurements, time range, land use and elevation. Interactive Grafana dashboards show dynamic graphs of the time series.
Keywords
Open Data; FAIR; Micrometeorology; LTER Italy; Mountain Ecology; SnipeIT; Grafana; InfluxDB
Introduction
Often, ecological research is restricted to 3-5 years due to short term funding policy. However, ecosystems are dynamic entities across space and time, and understanding their functions and reaction to Global Change (Climate and Land Use Change), require long-term ecological observations. Within the last 40 years, several Long-Term Ecological Research (LTER) sites have been established worldwide to address this need. These research infrastructures are connected through umbrella networks such as the LTER-Europe and International ILTER. The IT25 LT(S)ER Matsch | Mazia (South Tyrol, Northern Italy) was officially established in 2014, with first microclimatic measurements from 2009. The IT25 LT(S)ER Matsch | Mazia monitoring infrastructure is represented by a network of 24 automatic microclimatic stations, logging several meteorological and biophysical variables. The stations are spread in a complex mountain catchment spanning between valley bottom and glacier areas, across an elevation gradient ranging from 1000 m to 2700 m. The Data Browser Match | Mazia was designed to provide a fast and comprehensible solution to access, visualize and download the microclimatic measurements with the overall aim to provide straightforward data accessibility and enhance dissemination. Numerous and diverse stakeholders would benefit from easily accessible and usable meteorological and biophysical data. The user friendly, accessible data can lead to new knowledge creation, innovation, integration with other data, creating ultimately, new unexplored outputs, and services. The IT25 LT(S)ER Matsch | Mazia supports the reuse of data and promotes the Findable, Accessible, Interoperable and Reusable (FAIR) Data Principles
Sensors and data flow
The IT25 LT(S)ER Matsch | Mazia monitoring stations are equipped with 18 different multiparametric sensors, measuring overall more than 250 micrometeorological, biophysical and maintenance parameters every 15 minutes. Moreover, to monitor phenology, five stations are also equipped with Phenocams that capture RGB and IR (Infrared) images of the surrounding landscape on an hourly basis. The list of the sensors can be found in Table
List of the multiparametric sensors installed in the IT25 LT(S)ER Matsch | Mazia research site.
|
Sensors |
|
Thermo-Hygrometer (air temperature and humidity) |
|
Two-Dimensional Anemometer (wind speed & direction) |
|
4-Component Net Radiometer (solar radiation - shortwave & longwave, incoming & outgoing) |
|
Silicon-Cell Pyranometer (solar shortwave radiation) |
|
Quantum Sensor (PAR Photosynthetically Active Radiation) |
|
Line Quantum Sensor (PAR on the ground through the canopy & snow coverage detection) |
|
Sunshine Sensor (solar radiation – total & diffuse component, sunshine detection) |
|
SRS Spectral Reflectance Sensor (NDVI Normalized Difference Vegetation Index & PRI Photochemical Reflectance Index) |
|
Tipping Bucket Rain Gauge (cumulated precipitation) |
|
Weighing Rain Gauge (cumulated precipitation & precipitation intensity) |
|
Sonic Ranging Sensor (snow/canopy height) |
|
Infrared Radiometer (soil surface temperature) |
|
Heat Flux Plate (soil heat flux) |
|
Thermocouple (ST Soil Temperature – 0, 5, 10, 20 & 50 cm depth) |
|
FDR Frequency Domain Reflectometer (Soil Water Content – 5 & 20 cm depth) |
|
TDR Time Domain Reflectometer (Soil Water Content & Soil Temperature – 2, 5, 20, 40 & 50 cm depth) |
|
water potential sensor (SWP Soil Water Potential & Soil Temperature - 5, 20, 40 & 50 cm depth) |
|
LWS Leaf Wetness Sensor |
|
Phenocam (RGB and IR Infrared Images) |
Usage
The Matsch | Mazia Data Browser is designed for the general public and expert users and is available in English, German and Italian. The platform distinguishes two kinds of users: Not registered users (hereafter "public users") and registered users (hereafter "research users"). The public users have access to 20 monitoring stations for a subset of meteorological variables (air temperature, relative humidity, global radiation, precipitation, snow height, wind speed, gust and direction) with an open data CC BY 4.0 license. The research users can access the full dataset with a simple registration process using several identity providers (Google, Microsoft, GitHub). The Scientific Network South Tyrol research users can register using the Scientific Network South Tyrol as identity provider. The research users have full access to all 24 monitoring stations' measurements with a specific data usage agreement
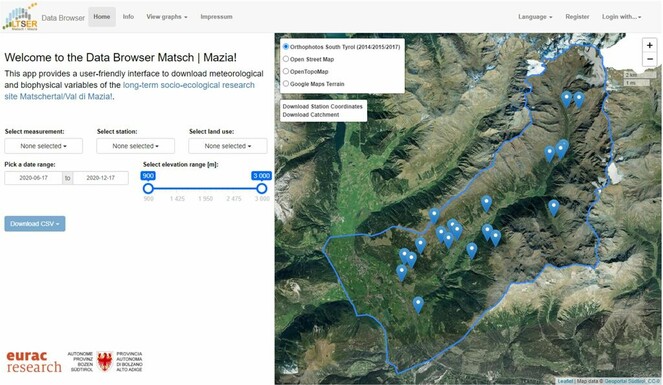
Main dashboard of the Matsch | Mazia Data Browser. Home, Info, View graphs, language, registration and login section, Map area. The elements of the page: Home (Query selectors for measurement, station, land use, date range, elevation and download CSV); Info (Basic info, Data license, disclaimer, and brief how-to); View Graphs (Grafana dashboard with dynamic graphs of the public data); Map area (point location of the stations, download coordinates and catchment boundaries).
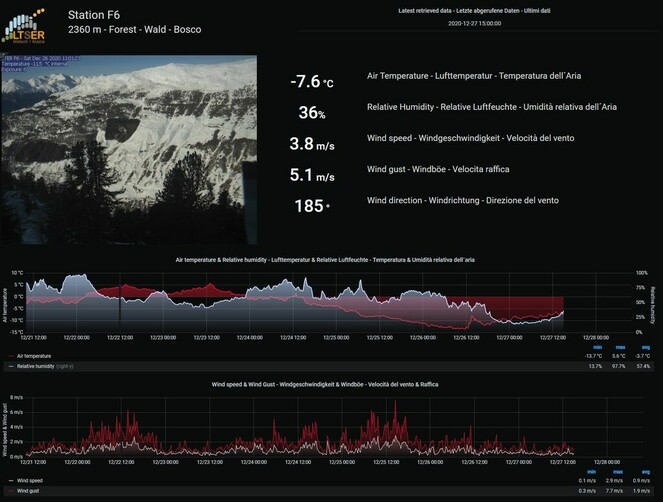
Example of a Grafana dashboard, showing one week of the near real-time publicly available data. Notice that some stations are equipped with webcams (Phenocam).
Project description
This work was funded by the research grant' LT(S)ER' of the South Tyrol (Italy). Department of Innovation, Research and University of the Autonomous Province of Bozen/Bolzano, Italy.
Web location (URIs)
Technical specification
Usage licence
Additional information
Further information can be found in the IT25 LT(S)ER Matsch | Mazia project home page: http://lter.eurac.edu/en/.
References
- Leaflet - a JavaScript library for interactive maps. http://leafletjs.com/. Accessed on: 2020-9-04.
- Memorandum for sharing data and information within the LTER-Italy network.Zenodohttps://doi.org/10.5281/zenodo.3763377
- Data use agreement - LT(S)ER IT25 Matsch | Mazia - Data Browser.Zenodohttps://doi.org/10.5281/zenodo.4395810
- Tidy Data.Journal of Statistical Software59(10). https://doi.org/10.18637/jss.v059.i10
- The FAIR Guiding Principles for scientific data management and stewardship.Scientific Data3:1‑9. https://doi.org/10.1038/sdata.2016.18
- DEIMS-SDR – A web portal to document research sites and their associated data.Ecological Informatics5:15‑24. https://doi.org/10.1016/j.ecoinf.2019.01.005
- LT(S)ER IT25 Matsch | Mazia - Glossary.Zenodohttps://doi.org/10.5281/zenodo.4395990
Supplementary materials
Example of the CSV Long-format table that can be downloaded.
Example of the CSV Wide-format table that can be downloaded.