Example of a Grafana dashboard, showing one week of the near real-time publicly available data. Notice that some stations are equipped with webcams (Phenocam).
|
|
||
|
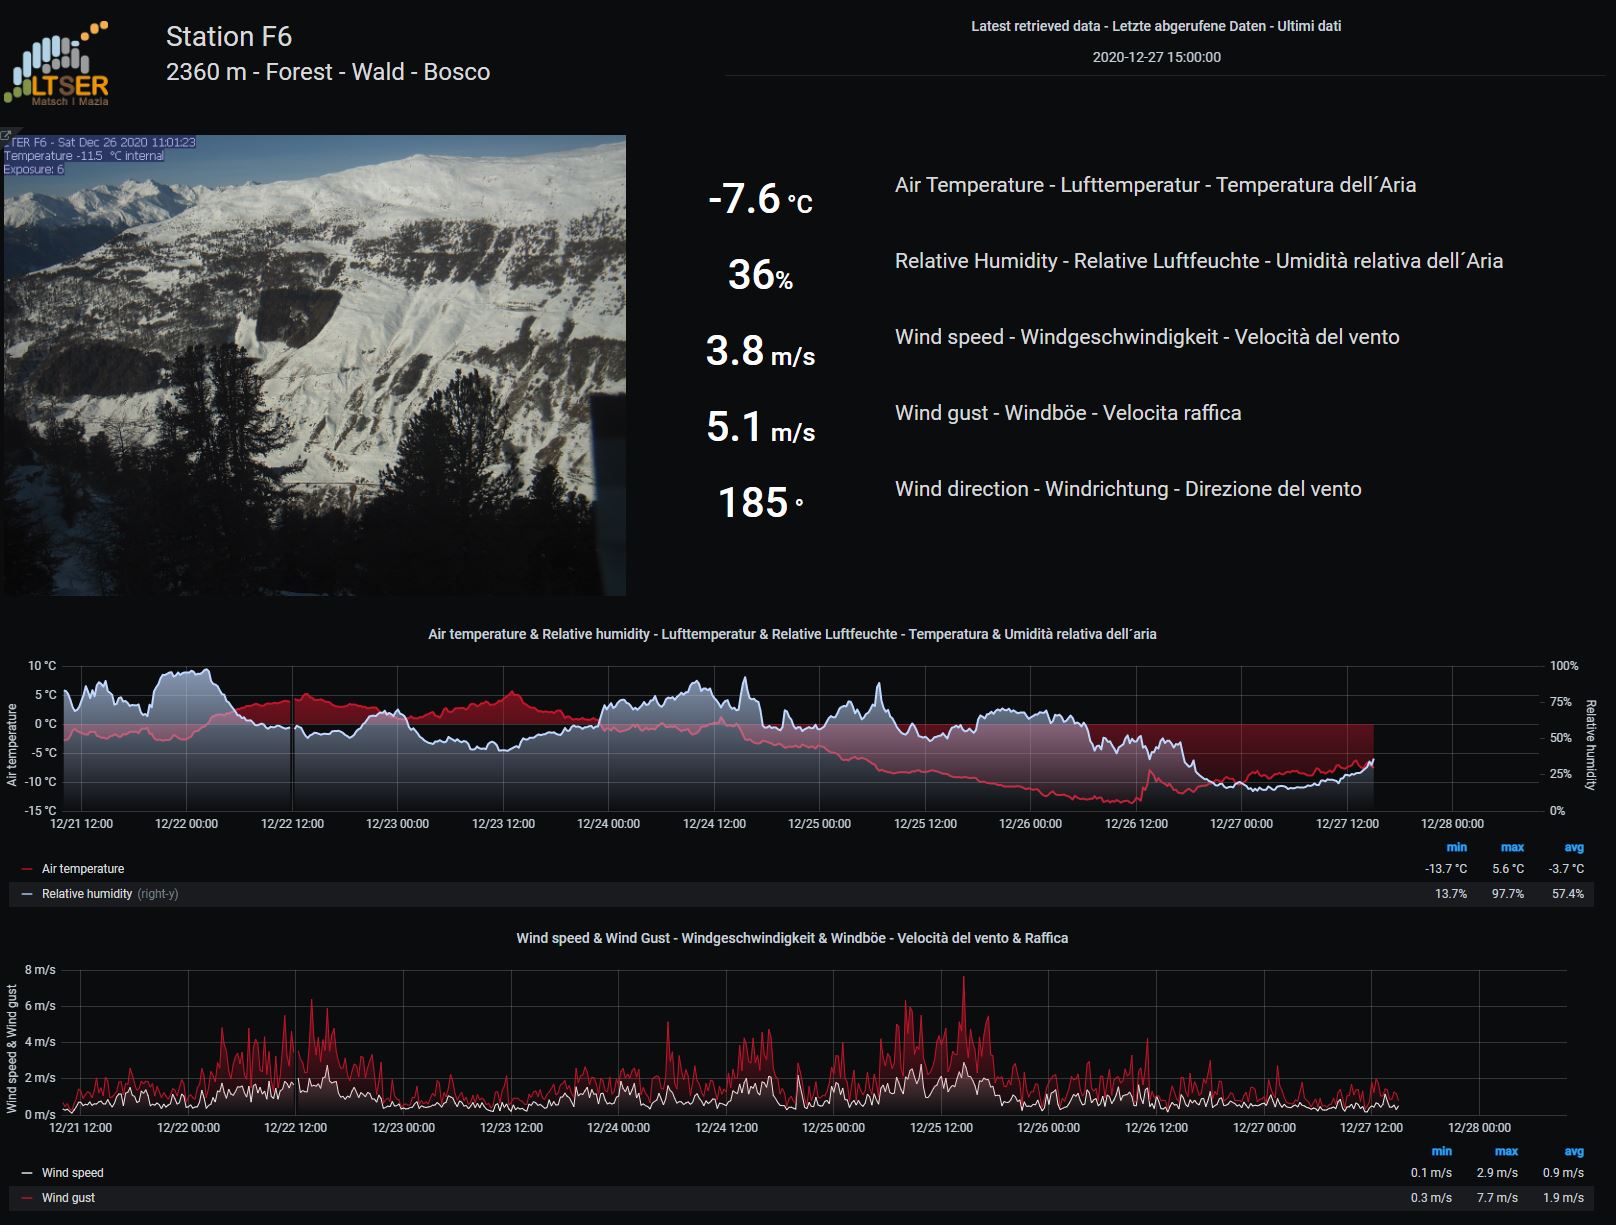
Example of a Grafana dashboard, showing one week of the near real-time publicly available data. Notice that some stations are equipped with webcams (Phenocam). |
||
| Part of: Palma M, Zandonai A, Cattani L, Klotz J, Genova G, Brida C, Andreatta N, Niedrist G, Della Chiesa S (2021) Data Browser Matsch | Mazia: Web Application to access microclimatic time series of an ecological research site. Research Ideas and Outcomes 7: e63748. https://doi.org/10.3897/rio.7.e63748 |