|
Research Ideas and Outcomes :
Workshop Report
|
|
Corresponding author: Laura Paglione (lpaglione@metadata2020.org)
Received: 03 Apr 2020 | Published: 06 Apr 2020
© 2020 John Chodacki, Ted Habermann, Ginny Hendricks, Kathryn Kaiser, Jennifer Kemp, Alice Meadows, Laura Paglione, Ed Pentz, Howard Ratner, Paula Reeves, Juliane Schneider, Sarah Stacey, Michelle Urberg
This is an open access article distributed under the terms of the Creative Commons Attribution License (CC BY 4.0), which permits unrestricted use, distribution, and reproduction in any medium, provided the original author and source are credited.
Citation: Chodacki J, Habermann T, Hendricks G, Kaiser K, Kemp J, Meadows A, Paglione L, Pentz E, Ratner H, Reeves P, Schneider J, Stacey S, Urberg M () Metadata 2020 Workathon Proceedings - Sept 2019. . https://doi.org/
|
|
Abstract
Metadata 2020 have been thinking about how to spend the time during 2020 to ensure that our efforts result in the greatest impact possible. In reviewing our midpoint outputs, we recognized that a key piece that often is missing in the Scholarly Communications Metadata discussion is the change management activities necessary to ensure sustained action toward richer metadata. We feel that effective work here is essential to spur investment and evolved and widespread improved perspectives for metadata. On September 18-19, 2019, we held a Workathon workshop with key contributors to Metadata 2020 to discuss strategies and tactics for catalyzing this action. This paper provides the results of these discussion
Keywords
metadata, strategy, workshop, proceedings, incentives
Date and place
18-19 September 2019 | Brooklyn, New York
List of participants
ATTENDING
Alice Meadows, Ed Pentz, Ginny Hendricks, Howard Ratner, Jennifer Kemp, John Chodacki, Juliane Schneider, Kathryn Kaiser, Laura Paglione, Michelle Urberg, Paula Reeves, Sarah Stacey, Ted Habermann... and Pepper, the meeting kitty (Fig.
REGRETS
Cameron Neylon, Clare Dean, Jim Swainston, Helen Williams, T. Scott Plutchak.
Introduction
Metadata 2020*
Aims of the workshop
The goal of this workshop was to:
- consider the scholarly communications audiences that the Metadata 2020 output(s) might target for the culminating output, and
- explore what output(s) would deliver the biggest value to this (these) audience(s).
This workshop was designed by Laura Paglione based on a process called Value Proposition Design (
Who are the audiences?
Consider the audiences in the scholarly communications community that the Metadata 2020 output(s) might target for the culminating output
- Audiences for the culminating output - How might we segment the potential audiences for the culminating work? What are the set of characteristics that we assume, observe, and verify about them?
What outputs will deliver value?
Explore what output(s) would deliver the biggest value to this (these) audience(s)
- Reviewing the existing outputs - Review of the projects and their related outputs to understand how they benefit these audiences, and may be leveraged for the culminating output.
- Understanding output value to the audiences - Consider the Metadata 2020 Outputs. What is the set of value proposition benefits that we have designed to attract the audiences? Do our current outputs address what matters to the audiences? What is well covered? What is missing?
- Prototyping possibilities - Considering what we already have, what can the culminating work be that will create the greatest value proposition for these audiences? How can we innovate from the Audience Profiles and existing value propositions/ outputs?
Next Steps
How do we proceed over the next year to produce impact?
- Where should we go from here? - We have explored many Value Propositions, what provides the greatest benefit? What are the next steps?
Key outcomes and discussions
The outcomes were grouped into three types:
- The key audiences for Metadata 2020 work
- An analysis of the existing Metadata 2020 outputs and their impact for the key audiences
- The results of prototyping prospective culminating outputs
The Audiences for Metadata 2020 work
The group reviewed the Metadata 2020 mission, and considered who would be instrumental in achieving these goals. After brainstorming a list of specific people that would be critical to achieving the mission, four audience segments were selected as potential targets for the culminating work:
Solution builders
-
Content directors
-
Policy & social influencers
-
Researchers
Audience Segment Profiles
For each of these audiences, we created an “Audience Segment Profile.” The Audience Segment Profile describes a specific group that will be impacted by our culminating output in a more structured and detailed way. It breaks the audience down into its jobs, pains, and gains.
- GAINS describe the outcomes those assuming the persona want to achieve or the concrete benefits they are seeking.
- PERSONA JOBS describe what those assuming the persona are trying to get done in their work and in their lives, as expressed in their own words.
- PAINS describe bad outcomes, risks, and obstacles related to persona jobs.
The Solution Builders
(See an image of this profile from the workshop: Suppl. material
This audience includes those that design and build scholarly communication software and infrastructure to improve how metadata moves through the scholarly communications cycle. Any solution builder in a business context will need to demonstrate that this new product or design feature operates in the best interest of the company’s outputs. Our audience needs to know what key gains to metadata production and use they can make with a new or refined product and how a new product or system will navigate risks of changing their metadata flows. This audience does not need the technical details germane to their business, but it does need persuasive points that Metadata 2020 information reflects where the scholarly communications industry is headed.
Positions for the solution builder audience include product managers, directors of content or production in a scholarly communications context, and possibly technical roles like software engineers and database designers. The key drivers that influence this group include (Table
The Solution Builders Audience Profile.
|
JOBS |
PAINS |
GAINS |
|
|
|
|
In addition, this audience had other drivers including: |
||
|
Jobs
|
Pains
|
Gains
|
The Content Directors
(See an image of this profile from the workshop: Suppl. material
This audience includes those that direct content creation and use, such as editors, and repository owners. Content directors are scholarly communications professionals in charge of making decisions on what specific types of content will be published by their publication or channel.
Jobs for this group may contain content director audience include journal editors-in-chief, society publication committees or boards, and database curators. The key drivers that influence this group include (Table
The Content Directors Audience Profile.
|
JOBS |
PAINS |
GAINS |
|
|
|
|
In addition, this audience had other drivers including: |
||
|
Jobs
|
Pains
|
Gains
|
The Policy/ Society Influencers
(See an image of this profile from the workshop: Suppl. material
This audience includes those that influence research policy and/or society in ways that direct development choices of research tools, workflows, and processes. This group may contain funders, advocacy groups, national and international efforts (like open access, or FAIR), and others. One such policy influencer could be the Lead for cOAlitionS (Johan Rooryck), a group of research funders setting mandates for publishers and institutions about how to share research. Some of their guidelines already include metadata even though it might not be framed that way, and their goal is to help publishers to comply and progress toward a more open science future. A second person who would be more of a social influencer in this area could be Bill (& Melinda!) Gates; the Gates foundation is an influential supporter of open research and whilst not yet ‘woke’ about metadata richness, could be brought in as a key advocate. It was also discussed that groups like Sense About Science or FORCE, which are already representing broad views and a clear voice for research needs, have been excellent in campaigning for particular causes in this space.
This group may include people with job titles such as foundation program director, social media influencer, start-up investor, and futurist. The key drivers that influence this group include (Table
The Policy/ Society Influencers Audience Profile.
|
JOBS |
PAINS |
GAINS |
|
|
|
|
In addition, this audience had other drivers including: |
||
|
Pains
|
Gains
|
|
The Researchers
(See an image of this profile from the workshop: Suppl. material
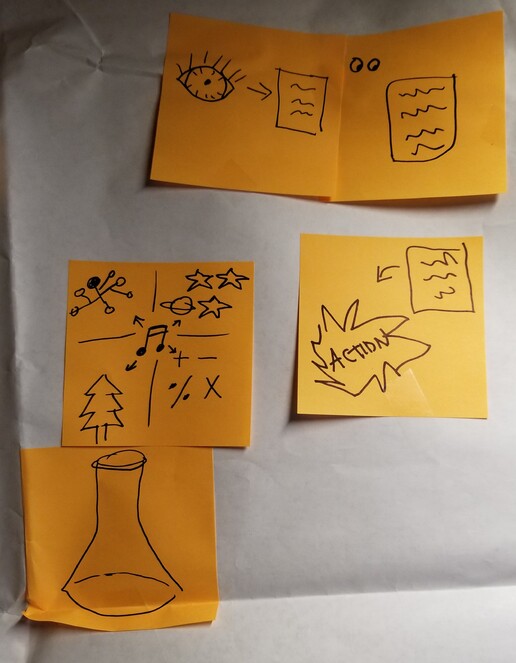
This audience includes researchers and others that are directly related to the creation and use of content. For example, a scientist at a state university with little funding. This group undergoes a cycle of Discovery -> Access -> Use -> Understand -> Trust. Those directly related to the creation and use of content
The key jobs, gains and pains that drive this audience include:
This group may include people with job titles such as professor, researcher, R&D specialist, and inventor. The key drivers that influence this group include (Table
The Researchers Audience Profile.
|
JOBS |
PAINS |
GAINS |
|
|
|
|
In addition, this audience had other drivers including: |
||
|
Jobs
|
Pains
|
Gains
|
Considering Existing Metadata 2020 Outputs
After reviewing the in-progress and completed outputs created by the project teams, the group considered what pains might be relieved or gains created for each audience segment as a result of these outputs. These insights were recorded in value proposition maps for each of the audiences. As teams built maps for their audiences, several remarked that the existing outputs in their current form may not be the best suited for these audiences. This outcome is not surprising, as the outputs were not originally created with these audiences in mind.
Value Proposition Map
The Value Map describes the features of value propositions for Metadata 2020 in a structured and detailed way. It breaks our value proposition down into outputs that we produce, and the resulting pains relieved and gains created.
- PRODUCTS AND SERVICES The list of all products and services (in our case, outputs) that the value proposition is built around.
- PAIN RELIEVERS describes how our outputs alleviate pains for our audience.
- GAIN CREATORS describe how our outputs create gains for our audience.
Value Map for the Solution Builders Audience Segment
(See an image of this value map from the workshop: Suppl. material
The current outputs are moderately well suited for this audience segment as shown below. This team further suggested that the Flow Diagram output needs to be persona specific to maximize its use for this audience, and the metadata evaluation will need a summary. Workathon participants brainstormed the pains that might be relieved and the gains created for this audience, resulting in the table below (Table
Value Map for Solution Builders.
|
PAIN RELIEVERS |
GAIN CREATORS |
|
|
Value Map for the Content Directors Audience Segment
(See an image of this value map from the workshop: Suppl. material
The current outputs are moderately well suited for this audience segment. Workathon participants brainstormed the pains that might be relieved and the gains created for this audience, resulting in the table below (Table
Value Map for Content Directors.
|
PAIN RELIEVERS |
GAIN CREATORS |
|
|
** Recommended extensions to the current outputs for this audience.
Value Map for the Policy/ Society Influencers Audience Segment
(See an image of this value map from the workshop: Suppl. material
The current outputs are moderately well suited for this audience segment. Workathon participants brainstormed the pains that might be relieved and the gains created for this audience, resulting in the table below (Table
Value Map for Policy/ Society Influencers.
|
PAIN RELIEVERS |
GAIN CREATORS |
|
|
** Recommended extensions to the current outputs for this audience.
Value Map for the Researchers Audience Segment
(See an image of this value map from the workshop: Suppl. material
The current outputs are moderately well suited for this audience segment. Workathon participants brainstormed the pains that might be relieved and the gains created for this audience, resulting in the table below (Table
Value Map for Researchers.
|
PAIN RELIEVERS |
GAIN CREATORS |
|
|
Prototyping Prospective Culminating Outputs
The group brainstormed prospective culminating outputs that would directly address the jobs, pains and gains of the audiences. Each value proposition is evaluated via an "Idea Scorecard", that is designed to provide insight about the feasibility, potential impact and alignment of the idea to the stated goals. More details of the evaluation methodology can be found in the endnotes*
Advocacy Campaign: Score 26.6
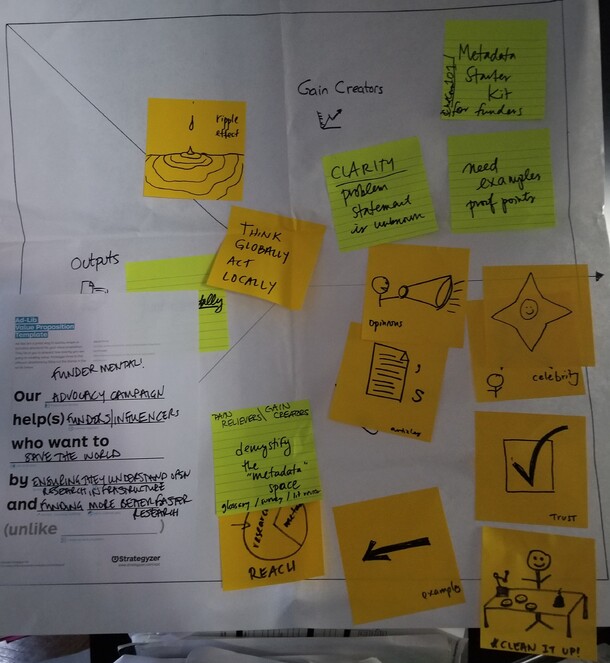
Our advocacy campaign helps funders/ influencers who want to save the world by ensuring they understand open research infrastructure and can fund more, better, and faster research.
This solution aims to create a ripple effect of organizations that think globally while acting locally. It uses expert opinions, articles, examples and ‘celebrity’ endorsements to demystify the “metadata” space and its benefits, thereby building trust and increasing research impact and reach (Fig.
IDEA SCORECARD (Table
Idea Scorecard: Advocacy Campaign (score 26.6/30).
|
How well does this output do the following? |
Score |
|
1. Have a sustainable model |
2.4 |
|
2. FOCUS: important jobs, extreme pains, & essential gains? |
3.0 |
|
3. FOCUS: unsatisfied jobs, unresolved pains, & unrealized gains? |
3.0 |
|
4. Have few pain relievers and gain creators but does those extremely well? |
2.5 |
|
5. Address functional, emotional and social jobs? |
2.4 |
|
6. Align w/target audience measures of success? |
2.8 |
|
7. Focus on high-impact, jobs, pains or gains? |
2.8 |
|
8. Have meaningful differentiation from other solutions? |
3.0 |
|
9. Outperform other solutions? |
1.8 |
|
10. Is it difficult to copy? |
2.9 |
|
26.6 |
Portfolio of Experiments: Score 25.4
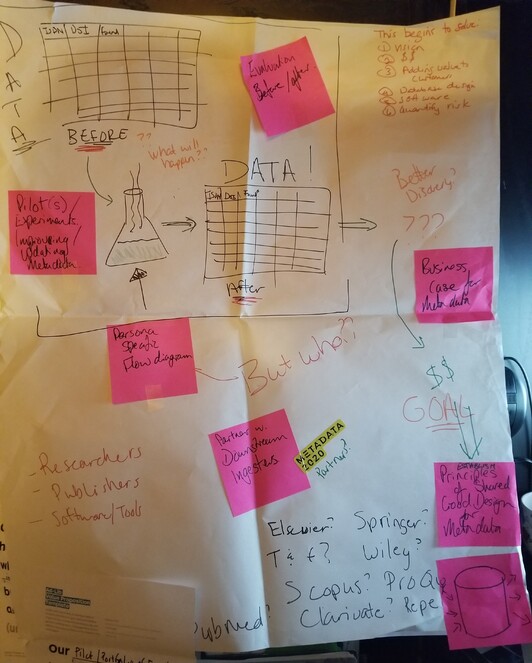
Our portfolio of experiments is designed to help product developers & solution builders establish shared principles of good metadata design in their organization. It will provide sample experiements that can enhance discoverability through better metadata. These suggestions aim to reduce business risk and increase profits and customer satisfaction.
This solution provides a data engine with a collection of experiments where one learn how how metadata is used and rmanipulated. Relying on persona-specific flow diagrams, this information provides evidence to be used in business cases, featuring a set of principles of shared good design for metadata (Fig.
IDEA SCORECARD (Table
Idea Scorecard: Pilot/ Portfolio of Experiments (score 25.4/30).
|
How well does this output do the following? |
Score |
|
1. Have a sustainable model |
2.3 |
|
2. FOCUS: important jobs, extreme pains, & essential gains? |
2.9 |
|
3. FOCUS: unsatisfied jobs, unresolved pains, & unrealized gains? |
3.0 |
|
4. Have few pain relievers and gain creators but does those extremely well? |
2.4 |
|
5. Address functional, emotional and social jobs? |
2.6 |
|
6. Align w/target audience measures of success? |
2.3 |
|
7. Focus on high-impact, jobs, pains or gains? |
2.3 |
|
8. Have meaningful differentiation from other solutions? |
2.8 |
|
9. Outperform other solutions? |
2.5 |
|
10. Is it difficult to copy? |
2.3 |
|
25.4 |
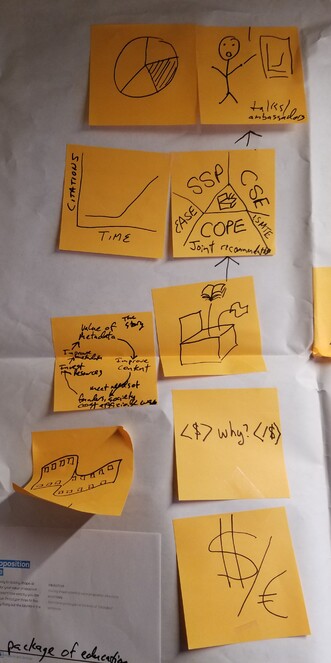
Collaboration with CEASESE/ : Score 25.2EASE
Our collaboration with CSE/ EASE helps content directors who want to improve all aspects of their job by decreasing stagnation and increasing community recognition of metadata importance.
This solution aims to create a collaboration with organizations such as Society for Scholarly Publishers (SSP), Council of Science Editors (CSE), Committee on Publication Ethics (COPE), European Association of Science Editors (EASE), and International Society of Managing and Technical Editors (ISMTE) for the purposes of creating joint recommendations, increased awareness leading to increased action (Fig.
IDEA SCORECARD (Table
Idea Scorecard: Collaboration with CSE/ EASE (score 25.2/30).
|
How well does this output do the following? |
Score |
|
1. Have a sustainable model |
2.2 |
|
2. FOCUS: important jobs, extreme pains, & essential gains? |
3.0 |
|
3. FOCUS: unsatisfied jobs, unresolved pains, & unrealized gains? |
2.4 |
|
4. Have few pain relievers and gain creators but does those extremely well? |
2.6 |
|
5. Address functional, emotional and social jobs? |
2.5 |
|
6. Align w/target audience measures of success? |
2.5 |
|
7. Focus on high-impact, jobs, pains or gains? |
2.5 |
|
8. Have meaningful differentiation from other solutions? |
2.0 |
|
9. Outperform other solutions? |
2.8 |
|
10. Is it difficult to copy? |
2.7 |
|
25.2 |
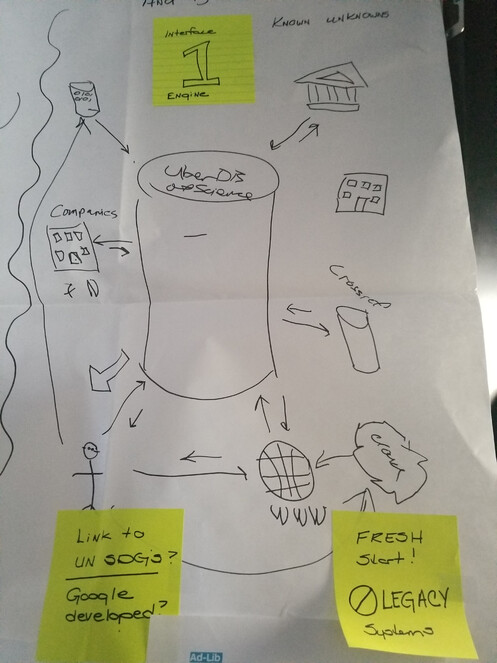
Data Warehouse: Score 24.6
THE (total -> huge -> encompassing) data warehouse helps scientists who want to know the unknowns by capturing all relevant records and reducing waste and increasing discovery.
This solution aims to centralize (the metadata) resources for scientists to enable a single interface/ search engine for finding and using resources. It advocates for a fresh start to replace legacy systems (perhaps developed by an organization like Google), and emphasize indexing of information around a broader goal such as the UN Sustainability Development Goals (Fig.
IDEA SCORECARD (Table
Idea Scorecard: Data Warehouse (score 24.6/30).
|
How well does this output do the following? |
Score |
|
1. Have a sustainable model |
1.8 |
|
2. FOCUS: important jobs, extreme pains, & essential gains? |
2.8 |
|
3. FOCUS: unsatisfied jobs, unresolved pains, & unrealized gains? |
2.6 |
|
4. Have few pain relievers and gain creators but does those extremely well? |
2.6 |
|
5. Address functional, emotional and social jobs? |
2.4 |
|
6. Align w/target audience measures of success? |
2.1 |
|
7. Focus on high-impact, jobs, pains or gains? |
2.4 |
|
8. Have meaningful differentiation from other solutions? |
2.3 |
|
9. Outperform other solutions? |
2.6 |
|
10. Is it difficult to copy? |
3.0 |
|
24.6 |
Education Materials: Score 21.8
Our package of education materials help editors and publishers who want to increase citations, improve discovery of content, and be more efficient by providing evidence for investment and increasing discoverability and reputation unlike spending money on Search Engine Optimization (SEO).
This solution uses an education solution to make the business case for investment by providing evidence of the expected benefits and outcomes (Fig.
IDEA SCORECARD (Table
Idea Scorecard: Education Materials (Score 21.8/30)
|
How well does this output do the following? |
Score |
|
1. Have a sustainable model |
1.7 |
|
2. FOCUS: important jobs, extreme pains, & essential gains? |
2.3 |
|
3. FOCUS: unsatisfied jobs, unresolved pains, & unrealized gains? |
2.0 |
|
4. Have few pain relievers and gain creators but does those extremely well? |
1.8 |
|
5. Address functional, emotional and social jobs? |
2.0 |
|
6. Align w/target audience measures of success? |
2.2 |
|
7. Focus on high-impact, jobs, pains or gains? |
2.5 |
|
8. Have meaningful differentiation from other solutions? |
2.5 |
|
9. Outperform other solutions? |
2.9 |
|
10. Is it difficult to copy? |
1.9 |
|
21.8 |
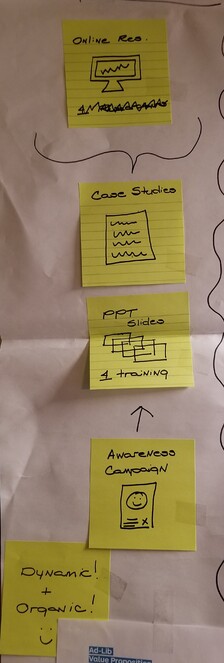
Online resource: Score 19.9
Our online resource helps gatekeepers who want to influence and educate with strong tools & evidence that stimulates action, which in turn leads to richer metadata.
This solution is a dynamic and organic platform that continually reinforces the metadata value proposition by providing resources, case studies, and powerpoint slides for training. Paired with a strong awareness campaign, the platform encourages contributions through community sourcing that further strengthen its value (Fig.
IDEA SCORECARD (Table
Idea Scorecard: Online Resource (Score 19.9/30).
|
How well does this output do the following? |
Score |
|
1. Have a sustainable model |
2.0 |
|
2. FOCUS: important jobs, extreme pains, & essential gains? |
2.0 |
|
3. FOCUS: unsatisfied jobs, unresolved pains, & unrealized gains? |
3.0 |
|
4. Have few pain relievers and gain creators but does those extremely well? |
2.1 |
|
5. Address functional, emotional and social jobs? |
1.8 |
|
6. Align w/target audience measures of success? |
1.7 |
|
7. Focus on high-impact, jobs, pains or gains? |
2.0 |
|
8. Have meaningful differentiation from other solutions? |
1.7 |
|
9. Outperform other solutions? |
2.0 |
|
10. Is it difficult to copy? |
1.6 |
|
19.9 |
Concluding Thoughts
The group talked a bit about next steps and for the proposed outputs, what exactly should be done directly by those involved with Metadata 2020 vs collaboration with and encouragement of other institutions and projects to act on these ideas. In cases where partnership is preferable, which institutions would be in the best position to effectively act on these ideas. In addition, some of these ideas may be combined with, or support each other in their implementation.
The group agreed that, regardless of other activities, an advocacy campaign would be a worthwhile activity for direct involvement by the Metadata 2020 participants. Experiments could be the “fuel” for the stories that would be told. In addition, the stories from the advocacy work could be used to inform the experiments. Some of these stories were collected during the first 6 months of Metadata 2020’s work. They could be combined with hard metrics to create urgency and bring greater attention to their lessons. This work would also reaffirm our mission as we connect to these audience segments.
A key next step will be to flesh out these ideas further, and to create a charter / team charge for moving this work further within the next year.
References
-
Value proposition design.1.Wiley,Hoboken, NJ,320pp. [ISBN978-1118968055]
Supplementary materials
A photo of the audience profile for Solution Builders as constructed during the workathon meeting.
A photo of the audience profile for Content Directors as constructed during the workathon meeting.
A photo of the audience profile for policy/ society influencers as constructed during the workathon meeting.
A photo of the audience profile for researchers as constructed during the workathon meeting.
A photo of the value map for solution builders as constructed during the workathon meeting.
A photo of the value map for content directors as constructed during the workathon meeting.
A photo of the value map for policy/ society influencers as constructed during the workathon meeting.
A photo of the value map for researchers as constructed during the workathon meeting.
Metadata 2020 Mission
Source: http://www.metadata2020.org/about/
WHAT? Metadata 2020 is a collaboration that advocates richer, connected, and reusable, open metadata for all research outputs, which will advance scholarly pursuits for the benefit of society.
HOW? We aim to create awareness and resources for all who have a stake in creating and using scholarly metadata. We will demonstrate why richer metadata should be the scholarly community’s top priority, how we can all evaluate ourselves and improve, and what can be achieved when we work harder, and work together.
WHY? Richer metadata fuels discovery and innovation. Connected metadata bridges the gaps between systems and communities. Reusable, open metadata eliminates duplication of effort. When we settle for inadequate metadata, none of this is possible and everyone suffers as a consequence.
Value Proposition Assessment
The brainstormed proposals for culminating outputs were evaluated by the team as per a set of assessment criteria:
- Is it embedded in a sustainable model?
- Does it focus on the most important jobs, most extreme pains, and most essential gains?
- Does it focus on unsatisfied jobs, unresolved pains, and unrealized gains?
- Does it concentrate on only a few pain relievers and gain creators but does those extremely well?
- Does it address functional, emotional, and social jobs all together?
- Does it align with how the target audience measures success?
- Does it focus on jobs, pains, or gains that a large number from our target audience have or for which a small number are willing to invest significant resources?
- Does it differentiate from other solutions in a meaningful way?
- Does it outperform other solutions substantially on at least one dimension?
- Is it difficult to copy?
Each workshop participant assessed the proposed culminating outputs according to the criteria above. The average score received for each criteria is calculated, and then the 10 values are added together to give each item a score of up to 30:
- Does not meet the criteria: VALUE - 1
- Neutral: VALUE - 2
- Meets the criteria: VALUE - 3