|
Research Ideas and Outcomes :
Project Report
|
|
Corresponding author: Kirstie Whitaker (kw401@cam.ac.uk)
Received: 06 Mar 2017 | Published: 08 Mar 2017
© 2017 Julia Leonard, John Flournoy, Christine Paula Lewis-de los Angeles, Kirstie Whitaker
This is an open access article distributed under the terms of the Creative Commons Attribution License (CC BY 4.0), which permits unrestricted use, distribution, and reproduction in any medium, provided the original author and source are credited.
Citation: Leonard J, Flournoy J, Lewis-de los Angeles CP, Whitaker K (2017) How much motion is too much motion? Determining motion thresholds by sample size for reproducibility in developmental resting-state MRI. Research Ideas and Outcomes 3: e12569. https://doi.org/10.3897/rio.3.e12569
|
|
Abstract
A constant problem developmental neuroimagers face is in-scanner head motion. Children move more than adults and this has led to concerns that developmental changes in resting-state connectivity measures may be artefactual. Furthermore, children are challenging to recruit into studies and therefore researchers have tended to take a permissive stance when setting exclusion criteria on head motion. The literature is not clear regarding our central question: How much motion is too much? Here, we systematically examine the effects of multiple motion exclusion criteria at different sample sizes and age ranges in a large openly available developmental cohort (ABIDE; http://preprocessed-connectomes-project.org/abide). We checked 1) the reliability of resting-state functional magnetic resonance imaging (rs-fMRI) pairwise connectivity measures across the brain and 2) the accuracy with which we can separate participants with autism spectrum disorder from typically developing controls based on their rs-fMRI scans using machine learning. We find that reliability on average is primarily sensitive to the number of participants considered, but that increasingly permissive motion thresholds lower case-control prediction accuracy for all sample sizes.
Keywords
Head motion, Developmental neuroimaging, Replicability
Background
A constant problem developmental imagers face is in-scanner head motion (
Here, we systematically examine the effects of multiple motion exclusion criteria at different sample sizes and age ranges in a large openly available developmental cohort (ABIDE;
Methods
In a cohort of 743 children (aged 6 to 18 years, 620 male), we varied motion cutoffs and sample size to explore how these variables impacted both split-half reliability and prediction accuracy of autism diagnosis using machine-learning. Specifically, we adjusted the sample size (from 10 to 100 participants) and the permitted number of volumes that exceeded a displacement from the previous volume by 0.2 mm (from 0 to 100%; details at http://preprocessed-connectomes-project.org/abide/quality_assessment.html). The input data for all analyses were individual pairwise correlation matrices using the 116 regions of interest (ROIs) defined in the Automated Anatomical Labeling (AAL) atlas (
For the split-half reliability analyses, we averaged the individual correlation matrices to give the average connection between each ROI-ROI pair in each group. We computed R-squared values for the fit between all the average pairwise correlations assuming the two groups were equal (Fig.
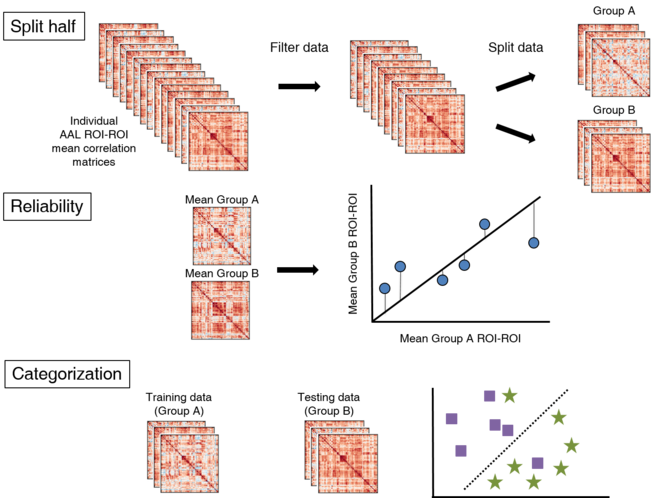
In order to investigate the effects of age range, motion exclusion threshold and sample size on functional connectiivity reliability we split the data into two matched samples. For the reliability analysis we averaged all participants in each sample and then calculated how well aligned the two groups were in terms of each pairwise regional connectivity measure. For the out-of-sample prediction analysis we used one half of the data to train a model and then tested it on the other half.
Another measure of how motion thresholds change the replicability of an analysis is out-of-sample predictive accuracy. We used the participants' resting state functional connectivity matrices as features to predict diagnostic category (Autism spectrum disorder vs typically developing controls). We designated one half of the data to be a training set and reserved the other for testing our model. The training generated a support vector machine (SVM) classifier with an L1 penalty tuned using 10-fold cross-validation (
Results
The split-half reliability analysis showed that reliability is primarily sensitive to the number of participants considered, with more participants leading to higher reliability (Fig.
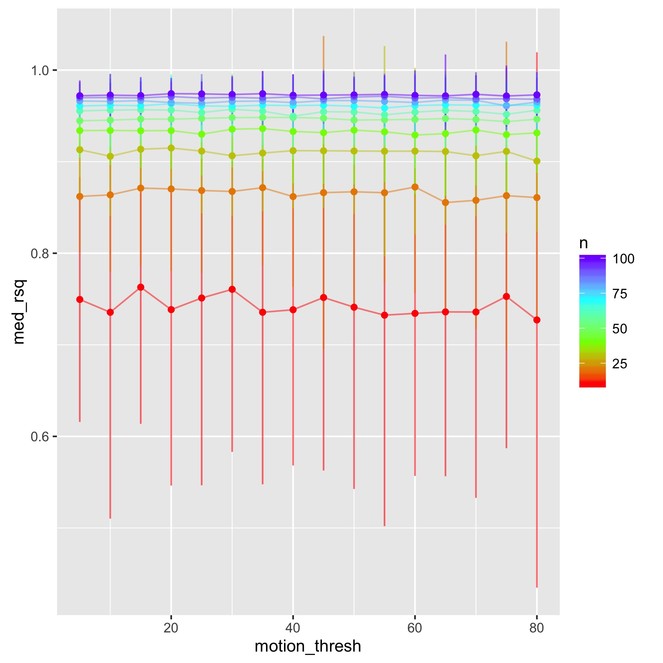
Split-half reliability results showing how sample size (N) has a large effect on R squared (median R squared from 100 permutations) while motion threshold does not. Error bars represent average 95% confidence intervals across 100 permutations. Code and output can be found on GitHub (
The results of the out-of-sample predictive accuracy analyses show that prediction accuracy is not only dependent on sample size but also on motion cutoffs. The best prediction was found in larger sample sizes with lower motion thresholds (Fig.

Out of sample prediction accuracy of autism diagnosis using resting state data as a function of sample size and motion-based exclusion criteria (percentage of fMRI, whole-brain volumes exceeding threshold). Red line is a naive classifier that assumes that all participants share the modal diagnosis (in this case, non-ASD). The black line spans the 5th to 95th percentile accuracy across iterations using a linear SVM, with the black points at the median value. Code and output can be found on GitHub (
As expected, larger sample sizes improve both of our reliability measures (R2 and prediction accuracy). We found that prediction accuracy decreased when the exclusion criteria for motion was made more lenient.
Conclusions and future directions
While this project is far from complete, we have shown that motion cutoffs, and sample sizes, and age ranges do affect reliability in developmental data. In future work, we would also like to explore how both motion thresholds and sample sizes might affect reliability differently by age range. Our end goal is to provide tool for authors to check their own datasets against our findings to ensure they make informed decisions when designing future developmental neuroimaging studies.
In a larger sense though, we have shown that bringing people together who work in a similar field (cognitive neuroscience) but from diverse backgrounds (developmental psychology, psychiatry, computational modeling, developmental cognitive neuroscience) for a one week hackathon can foster novel solutions to old problems. This cross-pollination of ideas brought a much needed fresh, rigorous methodological approach to developmental imaging and the week of fast learning inspired and prepared the next generation of cognitive neuroscientists to create thoughtful and reproducible work in the future.
Acknowledgements
This project report refers to work initiated at Neurohackweek 2016. Neurohackweek was supported through a grant from the Gordon & Betty Moore Foundation and the Alfred P. Sloan Foundation to the University of Washington eScience Institute Data Science Environment. KJW is funded by a Mozilla Science Lab fellowship.
Ethics and security
Each individual site that contributed data to the Autism Brain Imaging Data Exchange (ABIDE) project had to obtain their Institutional Review Board’s approval to participate, or an explicit waiver to provide fully anonymized data. Data were fully anonymized (removing all 18 HIPAA (Health Insurance Portability and Accountability)-protected health information identifiers, and face information from structural images). See
Author contributions
JL conceived the research question, KJW conceived the split-half analysis, JF conceived the machine learning analysis, CPDL synthesised previously published literature. All authors developed analysis code, ran and documented analyses, interpreted results, and wrote the paper.
Conflicts of interest
The authors declare no competing interests.
References
-
The Neuro Bureau Preprocessing Initiative: open sharing of preprocessed neuroimaging data and derivatives.Frontiers in Neuroinformatics7https://doi.org/10.3389/conf.fninf.2013.09.00041
-
Preparing children with a mock scanner training protocol results in high quality structural and functional MRI scans.European Journal of Pediatrics169(9):1079‑1085. https://doi.org/10.1007/s00431-010-1181-z
-
The autism brain imaging data exchange: towards a large-scale evaluation of the intrinsic brain architecture in autism.Molecular Psychiatry19(6):659‑667. https://doi.org/10.1038/mp.2013.78
-
Kids_Rsfmri_Motion: Brainhack Proceedings Submission - 20160201.Zenodohttps://doi.org/10.5281/ZENODO.266920
-
Scikit-learn: Machine Learning in Python.Journal of Machine Learning Research12(10):2825‑2830. URL: http://www.jmlr.org/papers/v12/pedregosa11a.html
-
Pediatric functional magnetic resonance imaging: progress and challenges.Topics in magnetic resonance imaging : TMRI13(1):61‑70. https://doi.org/10.1097/00002142-200202000-00005
-
Pediatric neuroimaging in early childhood and infancy: challenges and practical guidelines.Annals of the New York Academy of Sciences1252:43‑50. https://doi.org/10.1111/j.1749-6632.2012.06457.x
-
An improved framework for confound regression and filtering for control of motion artifact in the preprocessing of resting-state functional connectivity data.NeuroImage64:240‑56. https://doi.org/10.1016/j.neuroimage.2012.08.052
-
Automated anatomical labeling of activations in SPM using a macroscopic anatomical parcellation of the MNI MRI single-subject brain.NeuroImage15(1):273‑89. https://doi.org/10.1006/nimg.2001.0978
-
The influence of head motion on intrinsic functional connectivity MRI.NeuroImage59(1):431‑8. https://doi.org/10.1016/j.neuroimage.2011.07.044
-
The fMRI success rate of children and adolescents: Typical development, epilepsy, attention deficit/hyperactivity disorder, and autism spectrum disorders.Human Brain Mapping30(10):3426‑3435. https://doi.org/10.1002/hbm.20767