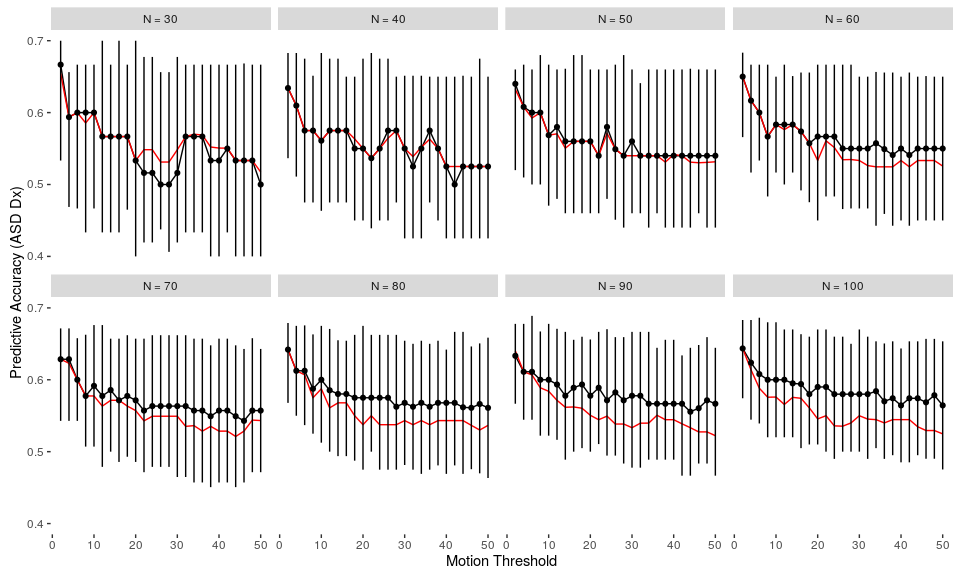
Out of sample prediction accuracy of autism diagnosis using resting state data as a function of sample size and motion-based exclusion criteria (percentage of fMRI, whole-brain volumes exceeding threshold). Red line is a naive classifier that assumes that all participants share the modal diagnosis (in this case, non-ASD). The black line spans the 5th to 95th percentile accuracy across iterations using a linear SVM, with the black points at the median value. Code and output can be found on GitHub (