|
Research Ideas and Outcomes : NIH Grant Proposal
|
|
Corresponding author: Arno Klein (arno@binarybottle.com)
Received: 13 Apr 2016 | Published: 21 Apr 2016
© 2016 Arno Klein, Satrajit S. Ghosh.
This is an open access article distributed under the terms of the Creative Commons Attribution License (CC BY 4.0), which permits unrestricted use, distribution, and reproduction in any medium, provided the original author and source are credited.
Citation: Klein A, Ghosh S (2016) Graph-based clinical diagnosis and prediction using multi-modal neuroimaging data. Research Ideas and Outcomes 2: e8835. doi: 10.3897/rio.2.e8835
|

|
Executive summary
The proposed research develops new computational tools to identify, diagnose, and predict treatment outcome for different mental illnesses. The research will be applied first to major depressive disorder, which affects millions of Americans, but is intended to be applied to any mental illness, such as Alzheimer’s disease, bipolar disorder, schizophrenia – indeed to analyze differences in brain structure, activity, or connectivity between any two populations.
Keywords
graphs, brain imaging, multimodal data
Specific research plan
Specific aims
There is a dire need for biomarkers to identify, diagnose, and predict treatment outcome for mental disorders [
- Create software framework for graph-based encoding of multimodal neuroimaging data. During this phase we will develop an open-source, well-documented software package for constructing and analyzing graph representations of structural, functional, and diffusion tensor magnetic resonance imaging (MRI, fMRI, and DTI) data.
- Quantify and compare graphs using “neural signatures.” In the second phase of this project, we will apply graph metrics and network analysis tools to extract a set of network characteristics for each individual. This set will comprise a neural signature for that individual. We will quantify and compare these neural signatures by computing network analysis metrics on them, and validate this approach by classifying data from publicly available sources. In particular, we will use neuroimaging, demographic and behavioral data from the International Neuroimaging Data-sharing Initiative (INDI), which contains datasets from several neurologically disordered populations. Once developed, we will engage the neuroimaging community to test our software on their own datasets during the remainder of the project period.
- Evaluate neurosignatures as biomarkers for diagnosis and prediction of treatment outcome. In the final phase of this proposal, we will apply pattern classification and regression techniques to identify clinically relevant biomarkers and predict course of illness (e.g., remitter/non-remitter) in the neural signatures in our own datasets, with the long-term goal of personalizing treatment using these biomarkers.
We believe this proposal to be significant because it will provide a means of computing comparisons across rich representations of brain image data and will attempt to diagnose and predict successful treatment options for individuals with mental disorders. This proposal is innovative because it will introduce formidable methods from graph theory and social network analysis to clinical brain research. Furthermore, this project will result in a general, open-source computational framework that anybody will be able to use with their own datasets, thus accelerating the rate at which various neurological disorders are diagnosed and treated.
Research strategy
1 Background and Significance
Diagnosis of mental disorders and prediction of treatment outcome suffers from a dearth of reliable biomarkers [
1.1 Biomarkers and mental disorders
The psychiatry literature contends that fundamental variation exists within current psychiatric disease categories at all levels (genetic, neurobiological, phenotypic, response to treatment). A proper understanding of this variation is essential for characterizing etiologies and enhancing treatments for these diseases. This idea is captured in the concept of personalized medicine, which has often focused on genetic variation as a potential predictor of treatment outcome. Neuroimaging measures may also provide important indices of patient variation because psychiatric diseases are understood as brain disorders, and brain structure and function reflect both genetic and environmental influences on current behavior.
A range of studies have shown that biomarkers predict prognoses among patients with behavioral disorders, and often more accurately than current behavioral instruments, such as widely used scales and structured interviews. Neuroimaging findings have predicted recovery from depression 8 months later [
To demonstrate the potential of biomarkers for prediction of treatment response, Dr. Ghosh analyzed pretreatment MRI and fMRI data from 30 patients with SAD who later underwent CBT (data collected by Dr. John Gabrieli - MIT, Dr. Mark Pollack - MGH and Dr. Steven Hoffman - BU). SAD is one of the most common psychiatric conditions in the United States. The two gold-standard treatments for SAD are CBT and pharmacotherapy, and are only moderately effective compared to placebo. A large proportion of patients remain symptomatic after an initial intervention, and no reliable predictor of treatment response has been identified. During fMRI, subjects viewed pictures of faces (angry or neutral) or scenes (emotional or neutral) that were matched for valence and arousal to the faces. Preliminary analyses indicated positive correlation between changes on the Liebovitz Social Anxiety Scale (LSAS) and the response to angry faces in regions of the higher-order visual cortex located on the fusiform and the parahippocampal gyri. A cross-validated prediction model yielded a strong correlation (r=0.8) between actual and predicted treatment response using data from these functional activations together with SPM-based VBM analysis of gray matter density in frontal and parietal regions and the pre-treatment LSAS score. Comparatively, the pre-treatment LSAS score alone is a much weaker predictor (r=0.14). These results demonstrate the potential for multimodal neuroimaging to guide clinical decisions that maximize the expected outcome from treatment interventions.
1.2 The need for better analysis tools
Advances in neuroimaging have opened up tremendous stores of rich, multimodal data from which biomarkers may be drawn. Multimodal data include structural, functional, and behavioral data from individual subjects, such as: magnetic resonance imaging (MRI), diffusion tensor imaging (DTI), and task-based and resting-state functional MRI (fMRI). These data sets and associated tools for efficient representation, manipulation and analysis will help provide clarification on observed inconsistences across current studies. “... for example, clustering is reportedly increased in the structural networks but decreased in the functional networks of patients with AD... Some of these differences may perhaps be resolved by studies combining network measurements on structural and functional neuroimaging data acquired on the same patients.” [
Traditional neuroimaging data analysis approaches typically rely on correlational paradigms and group activation maps. More recent work has attempted to characterize connectivity between regions either through structural equation modeling or functional connectivity networks. However, neither of these approaches handle multimodal data effectively. This has led to in-house software packages that aggregate information from structural and functional data in order to perform data maining or prediction. In order to break away from this mold and have comparable results across studies, it is important to have tools that allow users to efficiently integrate and analyze multimodal information. Dr. Ghosh has developed a framework (see http://nipy.org/nipype) that allows optimal analysis workflows using existing software, but there is still a need for a richer framework for data mining and prediction.
1.3 Graph theoretical methods and network analysis metrics
The difficulty with integrating data from multiple modalities is that it is computationally very demanding to analyze, and it is extremely difficult to conceptualize and visualize the relationships between objects in the data. Graph theory, a major area of mathematics concerned with graphs, is the field of mathematics to model relations between objects. Graphs are also a natural way to represent a connected network structure such as a brain and to quantify aspects such as similarity, hierarchy and network efficiency (
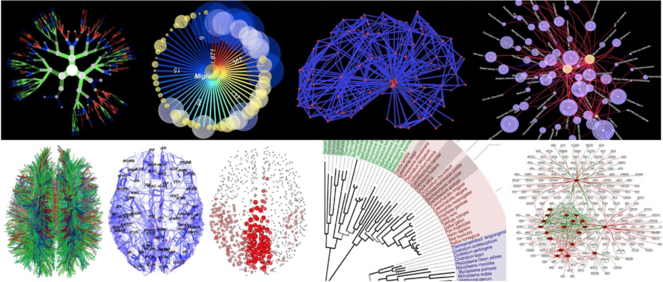
Examples of graph-based representations of scientific data among hundreds on the www.visualcomplexity.com website (categories on the site include biology, food webs and semantic, social, and knowledge networks). Lower left images of DTI, connectome, and network hubs are from Olaf Sporns (2010, Scholarpedia, 5(2):5584).
Only recently has neuroscience broached the subject of using graphs to characterize properties of functional imaging data [
Graphs provide an intuitive representation for each of the multimodal data types (MRI, fMRI, DTI) considered in this proposal. Furthermore, graphs can easily be transformed into adjacency matrices lending themselves to a whole assortment of linear algebra methods. In a recent book, Grady and Polimeni [
2 Innovation
The overall aim of the proposed research is to provide graph-based network analysis tools that help diagnose and predict treatment outcome of mental disorders. This is unique on several fronts:
- Represent multimodal data in a computationally addressable structure (i.e., a graph).
- Develop new tools in network analysis. This work will provide the first graph-based brain network analysis software package that combines graph-theoretical representation of multimodal imaging data, discrete calculus and pattern classification approaches.
- Move away from group-based studies and focus on individual variability. Current approaches to comparing brain images across subjects and across modalities rely almost ubiquitously on image registration to establish anatomical correspondence. Although functional ROI-based methods are emerging as an alternative to such registration, these capture very limited task-specific notions of correspondence. Our proposed software will move from macro-anatomy and functional blob-based comparisons towards network-based correspondences across individuals.
- Predict treatment outcome and diagnosis (e.g. graph similarity). This will be the first attempt to diagnose and predict recovery in major depressive disorder (MDD) using DTI, MPRAGE and fMRI information. If successful, it will open up the field of personalized medicine for MDD.
3 Approach
In the field of neuroimaging, most of the focus on graph-based computation has emerged in response to resting-state and other functional connectivity studies [
3.1 Create software framework for graph-based encoding of multimodal neuroimaging data
The brain, by its nature, lends itself to a graph-based representation. However, the key to a useful graph representation is a prudent choice of features embedded in vertices [
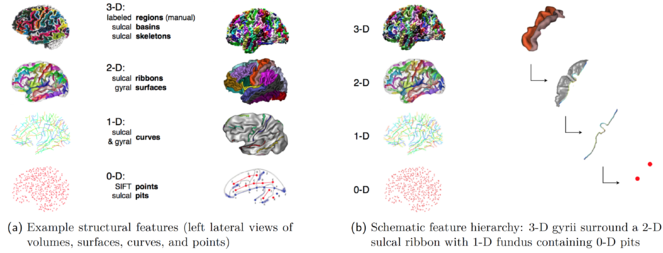
Examples of automatically extracted features (MRI)
(a) Example structural features (left lateral views of volumes, surfaces, curves, and points)
(b) Schematic feature hierarchy: 3-D gyrii surround a 2-D sulcal ribbon with 1-D fundus containing 0-D pits
Vertices
We will automatically extract features from brain image data and represent them as vertices. Each vertex can have multiple quantities associated with it. For example, any MRI feature could have an associated average measure of cortical surface curvature, gray matter thickness, etc. We will experiment with the following features to determine how consistently they can be extracted and how robust their correspondence is across brains:
- MRI: Scale Invariant Feature Transform (SIFT) points [
Lowe 1999 Lowe 2004 Toews 2009 Im et al. 2010 Lohmann et al. 2008 Rottenberg et al. 2007 Li et al. 2008 Cointepas et al. 2001 Cointepas et al. 2001 ,Dickson et al. 2001 ,Fischl et al. 1999 Rettmann et al. 2002 Lohmann and Cramon 2000 - fMRI: “blobs” of activity and functional connectivity clusters
- DTI: whole-brain network hubs [
Sporns et al. 2007 Wedeen et al. 2008
Edges
We will automatically compute relationships among the vertices and represent these relationships as edges in our brain graphs. The vertices and edges will be computed from within the same type of image as well as from different types of images. For example, we will connect MRI sulcal pits with DTI tracts (
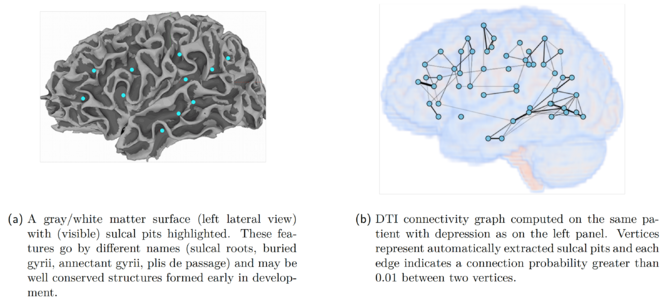
Example of a graph-based representation of MRI and DTI features
(a) A gray/white matter surface (left lateral view) with (visible) sulcal pits highlighted. These features go by different names (sulcal roots, buried gyrii, annectant gyrii, plis de passage) and may be well conserved structures formed early in development.
(b) DTI connectivity graph computed on the same patient with depression as on the left panel. Vertices represent automatically extracted sulcal pits and each edge indicates a connection probability greater than 0.01 between two vertices.
- MRI: physical path connecting two vertices
- fMRI: functional connectivity between vertices
- DTI: structural connections based on tractography
Network architecture based on sulcal features
We have automatically extracted SIFT points, sulcal pits, and sulcal fundi from patients with MDD and from controls, computed structural connections between these features using DTI probabilistic tractography (using FSL’s probtractx tool [
3.2 Quantify and compare graphs using “neural signatures”
We will use the Python library NetworkX to construct our graphs from the vertices and edges computed above and compute network analysis metrics on these structures. NetworkX provides a set of functions to quantify graphs for comparison and prediction. Among the metrics that we will evaluate which are relevant to brain architectures are the following:
- Eccentricity difference: The minimum (radius) and maximum (diameter) eccentricity is a measure of how close or how far vertices are to each other in a graph. For example, if vertices and edges represent functional regions and their connectivity, then low differences between minimum and maximum eccentricity would mean that the graph is strongly connected.
- Clique-set: A clique is a subgraph containing vertices that connect to each other. For example, if a graph contains edges that represent functional connectivity, then cliques from this graph would represent brain regions that behave like each other. The set of 3-vertex or higher cliques from such graphs can thus represent functionally similar networks.
- Centrality of weighted graphs: Centrality quantifies the extent to which a node or vertex is in the center of things (e.g., highly connected to important nodes). However, weighted graphs are more suited for representing brain features where the edges are often weighted by strength of connectivity or correlation. Centrality in weighted graphs has until recently evaded quantification. Opsahl and colleagues [
Agneessens et al. 2010 - k-core decomposition set: This operation defines subgraphs where every vertex has degree of at least k. This measure can be used to study the clustering of graphs and therefore break down whole-brain activation or structures into manageable subgraphs for comparison.
These metrics represent some of the network characteristics of an individual’s brain. We will test the discriminability of the different metrics on our data using recursive feature elimination. The most discriminable metrics will be collated into a vector of numbers to form the “neural signature” of macroanatomical structure, function and their connections for each individual, which may be quantified and compared against other individuals. We will determine the variation of these neural signatures by analyzing data from publicly available sources, such as the new International Neuroimaging Data-sharing Initiative (INDI), which contains multimodal datasets from several neurologically disordered populations.
3.3 Explore and quantify stable biomarkers for diagnosis and prediction of treatment outcome
The neural signatures above will then be used as input features for pattern classification (to predict diagnosis and remission) and regression (to predict treatment outcome). We will use the Python library PyMVPA for pattern classification. In addition, we expect our data to be noisy, and will therefore invoke methods from discrete calculus [
The tools we will develop to identify biomarkers are intended to be applied to any mental illness, such as Alzheimer’s disease, bipolar disorder, schizophrenia – indeed to analyze differences in brain activity between any two populations. However, we have targeted MDD and SAD to guide development and conduct validation of our methods. We will be processing SAD data (as described in (1.1)), and MDD data from two different grants for which our Co-Investigator Ramin Parsey, a leading researcher of depression, is a P.I. (Arno Klein (P.I.) is also a Co-Investigator on the second):
- “Biological Predictors of Response to Antidepressants” (MH074813)
- “Biosignature Discovery for Personalized Treatment of Depression” (1U01MH092250-01)
We will develop our methods on data from the first grant to determine the range of variation of our topological biomarkers, and will validate on some of the data from the second (U01) grant to try and diagnose individuals with MDD and predict treatment outcome based on remitter/nonremitter data. The U01 is a large, multi-site project acquiring multimodal brain imaging data from 400 individuals, specifically designed to make such data available to establish biomarkers for MDD. We will make use of the structural, functional and diffusion tensor 3.0T MRI data acquired from at least 40 of the U01 subjects that will be available within the next year:
- Structural 3D axial MPRAGE images (TE: 3.29 ms, TR: 2200 ms, Flip angle 9°, Field of view: 256x192 mm, Slice thickness: 1 mm, Matrix: 256x256, 192 continuous slices, 7:02 min)
- 4 fMRI tasks (emotional conflict, reward processing, PASL, and resting-state connectivity acquisition): 39 axial slices (3.1mm thick, TR/TE=2000/28msec, FOV=205x205cm, matrix=64x64; Flip angle=90°)
- DTI using echo planar imaging (voxel size: 2x2x2mm, 61 and 25 non-colinear directions; b-value=1000s/mm2)
If successful, this graph computational framework could be used to incorporate data from other neuroimaging modalities, such as electroencephalography, magnetoencephalography, positron emission tomography, angiography, and functional near-infrared spectroscopy. And whereas the focus in the present proposal is on macroscopic neuroimaging data, the framework could easily be applied to microscopic (histological) data, and indeed to nonbrain medical imaging data as well.
3.4 Conclusion and timeline
In the beginning of this proposal, we described the dire need for effective biomarkers of mental illness. We then presented formidable new computational tools that can find relationships in complex data – tools that could overcome shortcomings of present methods applied to brain image data. After outlining our methodological innovations, we described our research approach to find biomarkers of, for example, major depressive disorder.
Our timeline will be as follows:
Year 1: Develop software to extract features within individuals to build graphs. Create software to compute biomarkers on the graph-based framework.
Year 2: Determine the biomarkers’ range of variation. Test their validity on clinical data. Refine, test, and completely document the software for public distribution.
Resource sharing plan
1 Multiple Project Directors/Principal Investigators (PDs/PIs) Leadership Plan
1.1 Rationale for the multiple PIs
The project proposes multiple Principal Investigators to capitalize on the specific expertise of Dr. Klein and Dr. Ghosh. Because it proposes to develop graph theoretical methods to establish biomarkers based on automated extraction and processing of features and regions from multimodal brain image data, it is essential to have significant expertise in graph-based representations and in processing of multimodal brain image data (Ghosh) as well as expertise in brain image processing and region and feature extraction (Klein). Dr. Ghosh and Dr. Klein have collaborated for over five years and do not anticipate any conflicts, but should a conflict arise, they intend to resolve it by deferring to their Co-Investigator Dr. Parsey.
1.2 Expertise of Principal Investigators
Dr. Arno Klein is an Assistant Professor of Clinical Neurobiology at Columbia University. Dr. Klein’s research focuses on brain imaging, image processing, and information visualization. Dr. Klein received a B.S. in Biopsychology from the University of Michigan in 1993, an M.S. in Media Arts and Sciences from M.I.T. in 1996, and a Ph.D. in Neuroscience from the Weill Medical College of Cornell University in 2004. Prior to his appointment at Columbia University, Dr. Klein worked as an Information Synthesis Theorist and Program Analyst specializing in complex data visualization at the Parsons Institute for Information Mapping at the New School in New York. Dr. Klein has recently been publishing the largest registration and brain extraction algorithm evaluation studies ever conducted. He is presently the Principal Investigator on a 3-year NIMH-funded R01 titled “Mindboggling Shape Analysis and Identification.” His present involvement in the largest manual brain labeling effort ever undertaken (www.braincolor.org) and experience developing fully automated feature matching and brain anatomy labeling software (www.mindboggle.info) is evidence that he is well qualified to take on the responsibility of defining the anatomical regions and multimodal features for the proposal. Dr. Klein will be supervising DTI postprocessing as a Co-Investigator on a large, multi-site grant (“Biosignature Discovery For Personalized Treatment Of Depression” (1U01MH092250-01), P.I.: Ramin Parsey), and so he is in the best position to spearhead the DTI component of the proposed research, which will make use of the same data. Being an avid programmer, he will be able to contribute to the software development of the project.
Dr. Ghosh is a research scientist at the Research Laboratory of Electronics at MIT and a faculty member of the Speech and Hearing Biosciences and Technology program within the Harvard-MIT division of Health Sciences and Technology. He has extensive experience with functional and structural neuroimaging, signal processing and software development. He has developed state-of-the-art tools for real-time imaging and analysis of neuroimaging data. As P.I. of an R03 from NIBIB he initiated the development of a Python-based, open-source, multi-institution software project aimed at improving interoperability among existing imaging analysis software packages (http://nipy.org/nipype/). That project makes use of the NetworkX Python library for creating manipulating, and studying the structure, dynamics, and functions of complex networks. His expertise in the use of this library will be essential to the proposed project. His current research focus is on utilizing pattern classification approaches for diagnosis and prediction of treatment outcome of neurological disorders (social anxiety disorder,
Project
There is a dire need for biomarkers to identify, diagnose, and predict treatment outcome for mental disorders. Whereas neuroimaging capabilities have grown and computational tools for processing these data have become more sophisticated, comparisons across groups of patients and human subjects resort to overly simplistic representations of brain image data, resulting in simplistic biomarkers. The goal of this proposal is to create network analysis tools for multimodal brain image data to find biomarkers of mental disorders. The specific aims to achieve this goal are the following:
- Create software framework for graph-based encoding of multimodal neuroimaging data. We will develop an open-source, well-documented software package for constructing and analyzing graph representations of structural, functional, and diffusion tensor magnetic resonance imaging (MRI, fMRI, and DTI) data.
- Quantify and compare graphs using “neural signatures.” We will apply graph metrics and network analysis tools to extract a set of network characteristics for each individual. This set will comprise a neural signature for that individual, which may be quantified and compared against other individuals.
- Evaluate neurosignatures as biomarkers for diagnosis and prediction of treatment outcome. We will apply pattern classification and regression techniques to identify clinically relevant biomarkers and predict course of illness.
We believe this proposal to be significant because it will provide a means of computing comparisons across rich representations of brain image data and will attempt to diagnose and predict successful treatment options for individuals with mental disorders. This proposal is innovative because it will introduce formidable methods from graph theory and social network analysis to clinical brain research. Furthermore, this project will result in a general, open-source computational framework that anybody will be able to use with their own datasets, thus accelerating the rate at which various neurological disorders are diagnosed and treated.
Call
R21 (PA-10-069)
Hosting institution
Columbia University
Ethics and security
Only publicly available data will be used.
Author contributions
AK and SG authored this proposal.
Conflicts of interest
None
References
-
Node centrality in weighted networks: Generalizing degree and shortest paths.Social Networks32(3):245‑251. DOI: 10.1016/j.socnet.2010.03.006
-
Probabilistic diffusion tractography with multiple fibre orientations: What can we gain?NeuroImage34(1):144‑155. DOI: 10.1016/j.neuroimage.2006.09.018
-
Complex brain networks: graph theoretical analysis of structural and functional systems.Nature Reviews Neuroscience10(4):312‑312. DOI: 10.1038/nrn2618
-
Amygdala reactivity to emotional faces predicts improvement in major depression.NeuroReport16(12):1267‑1270. DOI: 10.1097/01.wnr.0000174407.09515.cc
-
Brain Imaging Correlates of Depressive Symptom Severity and Predictors of Symptom Improvement After Antidepressant Treatment.Biological Psychiatry62(5):407‑414. DOI: 10.1016/j.biopsych.2006.09.018
-
BrainVISA: Software platform for visualization and analysis of multi-modality brain data.NeuroImage13(6):98. DOI: 10.1016/s1053-8119(01)91441-7
-
Integrated software for surface-based analyses of cerebral cortex.NeuroImage13(6):148. DOI: 10.1016/s1053-8119(01)91491-0
-
Cortical Surface-Based Analysis.NeuroImage9(2):195‑207. DOI: 10.1006/nimg.1998.0396
-
Neural Responses to Happy Facial Expressions in Major Depression Following Antidepressant Treatment.American Journal of Psychiatry164(4):599‑607. DOI: 10.1176/ajp.2007.164.4.599
-
Introduction to Discrete Calculus.Discrete Calculus. URL: https://doi.org/10.1007/978-1-84996-290-2_2 DOI: 10.1007/978-1-84996-290-2_2
-
Prediction of children's reading skills using behavioral, functional, and structural neuroimaging measures.Behavioral Neuroscience121(3):602‑613. DOI: 10.1037/0735-7044.121.3.602
-
Spatial distribution of deep sulcal landmarks and hemispherical asymmetry on the cortical surface.Cerebral cortex (New York, N.Y. : 1991)20(3):602‑11. DOI: 10.1093/cercor/bhp127
-
Endophenotypes: Bridging Genomic Complexity and Disorder Heterogeneity.Biological Psychiatry66(11):988‑989. DOI: 10.1016/j.biopsych.2009.10.008
-
Use of Neuroanatomical Pattern Classification to Identify Subjects in At-Risk Mental States of Psychosis and Predict Disease Transition.Archives of General Psychiatry66(7):700. DOI: 10.1001/archgenpsychiatry.2009.62
-
Dorsolateral Prefrontal Cortex Activity Predicts Responsiveness to Cognitive–Behavioral Therapy in Schizophrenia.Biological Psychiatry66(6):594‑602. DOI: 10.1016/j.biopsych.2009.04.036
-
A Novel Method for Cortical Sulcal Fundi Extraction.Lecture Notes in Computer Science. URL: https://doi.org/10.1007/978-3-540-85988-8_33 DOI: 10.1007/978-3-540-85988-8_33
-
Automatic labelling of the human cortical surface using sulcal basins.Medical Image Analysis4(3):179‑188. DOI: 10.1016/s1361-8415(00)00024-4
-
Deep Sulcal Landmarks Provide an Organizing Framework for Human Cortical Folding.Cerebral Cortex18(6):1415‑1420. DOI: 10.1093/cercor/bhm174
-
Object recognition from local scale-invariant features.The Proceedings of the Seventh IEEE International Conference on Computer Vision.,2.IEEE,KerkyraDOI: 10.1109/ICCV.1999.790410
-
Distinctive Image Features from Scale-Invariant Keypoints.International Journal of Computer Vision60(2):91‑110. DOI: 10.1023/b:visi.0000029664.99615.94
-
Neurophysiology in Preschool Improves Behavioral Prediction of Reading Ability Throughout Primary School.Biological Psychiatry66(4):341‑348. DOI: 10.1016/j.biopsych.2009.02.031
-
Newborn and Preschool Predictors of Second-Grade Reading Scores: An Evaluation of Categorical and Continuous Scores.Journal of Learning Disabilities34(6):545‑554. DOI: 10.1177/002221940103400607
-
Anticipatory Activation in the Amygdala and Anterior Cingulate in Generalized Anxiety Disorder and Prediction of Treatment Response.American Journal of Psychiatry166(3):302‑310. DOI: 10.1176/appi.ajp.2008.07101682
-
Neural Activation Patterns of Methamphetamine-Dependent Subjects During Decision Making Predict Relapse.Archives of General Psychiatry62(7):761. DOI: 10.1001/archpsyc.62.7.761
-
Automated Sulcal Segmentation Using Watersheds on the Cortical Surface.NeuroImage15(2):329‑344. DOI: 10.1006/nimg.2001.0975
-
A Geometric Method for Automatic Extraction of Sulcal Fundi.IEEE Transactions on Medical Imaging26(4):530‑540. DOI: 10.1109/tmi.2006.886810
-
Identification and Classification of Hubs in Brain Networks.PLoS ONE2(10):e1049. DOI: 10.1371/journal.pone.0001049
-
Dealing with the shortcomings of spatial normalization: Multi-subject parcellation of fMRI datasets.Human Brain Mapping27(8):678‑693. DOI: 10.1002/hbm.20210
-
SIFT-Rank: Ordinal description for invariant feature correspondence.IEEE Conference on Computer Vision and Pattern Recognition.Miami, FL.IEEE
-
Mapping the Structural Core of Human Cerebral Cortex.PLoS Biology6(7):e159. DOI: 10.1371/journal.pbio.0060159
-
Functional Imaging as a Predictor of Schizophrenia.Biological Psychiatry60(5):454‑462. DOI: 10.1016/j.biopsych.2005.11.013
-
Whole-brain anatomical networks: Does the choice of nodes matter?NeuroImage50(3):970‑983. DOI: 10.1016/j.neuroimage.2009.12.027