|
Research Ideas and Outcomes : NSF Grant Proposal
|
|
Corresponding author: Arno Klein (arno@binarybottle.com)
Received: 11 Apr 2016 | Published: 13 Apr 2016
© 2016 Arno Klein.
This is an open access article distributed under the terms of the Creative Commons Attribution License (CC BY 4.0), which permits unrestricted use, distribution, and reproduction in any medium, provided the original author and source are credited.
Citation: Klein A (2016) Data-Visual Relationships to Subject Performance and Eye Movements. Research Ideas and Outcomes 2: e8814. doi: 10.3897/rio.2.e8814
|

|
Executive summary
Visual communication is ubiquitous, commanding our attention and commandeering our inattention. The presentation of information can take myriad visual forms, such as bar charts, scatter plots, network diagrams, and tables. These information graphics are attempts to map potentially large amounts of complex data to easily navigable visual form for rapid and accurate knowledge transfer. However, there is not yet a satisfactory formal methodology for selecting the most appropriate visualization method for a given set of data.
A data taxonomy and novel visual taxonomy will be used to select visual stimuli from a database of acquired and newly generated information graphics. Oculomotor responses (eye tracking data) and task-based responses (mouse clicks or keyboard input) are recorded; performance on the latter is used to establish an expert subgroup. These results will be used to satisfy the three primary objectives of the proposed research, determining:
- how the choice of data visualization impacts oculomotor behavior and task performance,
- if this behavior is discriminable between experts and novices, and
- an empirically-based taxonomy of visualization based on the results of 1 and 2.
Intellectual merit of the proposed activity
The proposed research will create a novel taxonomy for and database of acquired and generated information graphics as well as an associated web application to search, organize, and compare entries in the database. Part of this research program is intended to establish the most comprehensive, manually annotated (and taxonomically classified) information graphics database in the world, for use by the public via a web interface. These images will be important for procuring stimuli for other kinds of perceptual and cognitive psychology experiments. The eye tracking and task performance results should help lead to a better understanding of how humans look at data, respond to the relationship between data structures and visual composition, and respond differentially to visualizations of different types. With respect to qualifications, the PI has a background in brain imaging research, image processing, and programming applications for generating graphs. Through his collaborator Dr. Ferrera of Columbia University, he has access to facilities and faculty specialized in eye tracking and psychophysics research. Collaborator Dr. Michelle Zhou, a research manager at IBM T. J. Watson Research Center, has years of experience in the areas of data and visual taxonomies, image databases, and automated generation of information graphics [
Broader impacts of the proposed activity
In addition to contributions the image taxonomy, database, and web application are intended to make to research, they will serve as a rich resource for teaching about the history and scope of visualization methods and design within and across disciplines, and for the general public with an interest in information graphics. The research will be conducted on subjects of varied background and race and will be broadly disseminated via websites in addition to publications. Additionally, defining a visual taxonomy will inform design choices made in information visualization. One implication of this research is a determination of how effective different visualization methods are at conveying information; this understanding will be of profound help to anyone interested in conveying information effectively in a graphical form.
Keywords
eye tracking, eye movements, visualization, information graphics
Third parties involved in the project
Dr. Vincent Ferrera, NY State Psychiatric Institute, Columbia University, NY, NY
Plans for data management and sharing of the products of research
All software and data will be open (Apache v2.0 license) and freely available.
Project description
I. Objectives
The presentation of information can take myriad visual forms, such as bar charts, scatter plots, network diagrams, and tables. These information graphics are attempts to map potentially large amounts of complex data to easily navigable visual form for rapid and accurate knowledge transfer. However, there is not yet a satisfactory formal methodology for selecting the most appropriate visualization method for a given set of data. The research program outlined in this proposal has three primary objectives:
Objective 1: Characterize how the choice of information visualization method impacts task performance and oculomotor behavior.
Objective 2: Determine if this behavior is discriminable between experts and novices.
Objective 3: Construct an empirically-based taxonomy of visualization from 1 and 2.
Characterizing the effects that different visualization methods have on oculomotor behavior and task performance will help lead to a better understanding of how humans look at data, respond to the relationship between data structures and visual composition, and respond differentially to visualizations of different types. The information visualization methods will be differentiated by the categories of a visual taxonomy, and the data underlying each information graphic will be characterized by a data taxonomy. Given these taxonomical characterizations of an information graphic, if we correlate eye movements (implicit skill) with problem-solving ability (explicit skill), then the first objective raises four hypotheses and the second objective raises a fifth hypothesis:
Hypothesis 1: The effectiveness of an information visualization method (based on task performance) is a function of the task.
Hypothesis 2: The effectiveness of an information visualization method (based on task performance) is a function of underlying data features.
Hypothesis 3: Task performance is discriminable in accordance with the categories of a visual taxonomy.
Hypothesis 4: Eye movements are discriminable (i.e., there are “signatures”) in accordance with the categories of a visual taxonomy.
Hypothesis 5: Eye movements are discriminable between experts and novices.
Hypothesis 1 posits that the ability to perform a task related to an information visualization method depends on the task being performed. In other words, a given task is best performed on certain visualization types, and conversely, a visualization method is amenable to performing particular tasks. This research intends to establish these visual-task relationships for a range of visual and task categories.
Hypothesis 2 posits that the ability to perform a task related to an information visualization method also depends on the data structure (set of data features) underlying the visualization. In other words, given data are best treated by certain visualization methods, and conversely, a visualization method is best suited to represent particular data structures. This research intends to establish these data-visual relationships for a range of data and visual categories.
Hypotheses 3 and 4 are intended to substantiate and modify the visual taxonomy, and address the third objective above. They maintain that there is a mapping from subject task performance and eye path profiles for a given task set performed on given visualizations to the visual taxonomy characterizing these visualizations. This would result in a psychologically tested taxonomy, the first known to the author. Empirically defining a visual taxonomy will benefit education and research interested in the structure of visual information, and will inform design choices made in information visualization. One implication of this research is a determination of how effective different visualization methods are at conveying information; this understanding will be of profound help to anyone interested in communicating effectively in a graphical form.
Hypothesis 5 asserts that the eye movements are not only discriminable between visualizations, but between subject skill levels.
Methods pipeline
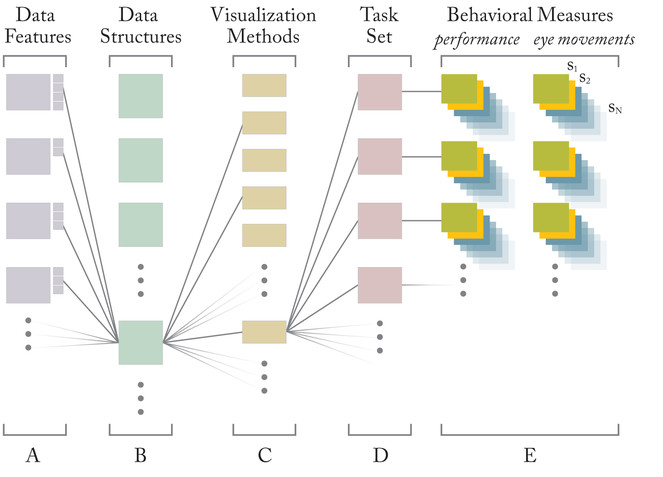
(A) Each data feature (scale, dimensionality, etc., defined by the data taxonomy), has attributes (e.g., scale may be set to nominal, ordinal, or ratio). The combination of attribute settings form (B) a data structure, which in turn is amenable to certain (C) visualization methods (defined by the visual taxonomy). When a visualization method is used to perform (D) a set of tasks, (E) performance and eye movement data are recorded for each of N subjects.
Section II will outline the behavioral data to be acquired and the methods to be employed in their acquisition and analysis. Section III will outline the visual taxonomy used to distinguish between information graphics stimuli, the basis from which a new visual taxonomy will be empirically derived.
Methods pipeline
(A) Each data feature (scale, dimensionality, etc., defined by the data taxonomy), has attributes (e.g., scale may be set to nominal, ordinal, or ratio). The combination of attribute settings form (B) a data structure, which in turn is amenable to certain (C) visualization methods (defined by the visual taxonomy). When a visualization method is used to perform (D) a set of tasks,
(E) performance and eye movement data are recorded for each of N subjects.
II. Methods
Stimulus acquisition and generation
Two sets of stimuli will be used for presentation: existing and generated information graphics. The existing images will be selected from a database under development by the PI whose images are being gathered from numerous image repositories on the internet, and will be classified according to the visual taxonomy in section III. The present database includes all of the images compiled by the Institute for Social Research at York University (http://www.math.yorku.ca/SCS/Gallery/), in the Atlas of Cyberspaces by the Center for Advanced Spatial Analysis at the University College London (http://www.cybergeography.org/atlas/), in Cartogram Central hosted by the National Center for Geographic Information and Analysis at UC Santa Barbara (http://www.ncgia.ucsb.edu/projects/Cartogram_Central/index.html), in the network image collection of visualcomplexity.com, as well as many other collections. Part of this research program will expand this effort to establish the most comprehensive, manually annotated (and taxonomically classified) information graphics database in the world, for use by the public via a web interface. We anticipate that it will be a valuable resource for research and for education at all levels, and that it will also be of general interest to a wide audience on the internet. In particular, the images will be important for procuring stimuli for various perceptual and cognitive psychology experiments, and will serve as a rich resource for teaching about the history and scope of visualization methods and design within and across disciplines.
The PI is in communication with collaborator Dr. Michelle Zhou of IBM to discuss the possibility of incorporating the framework underlying IBM's graphical database [
The second set of images will be generated to provide flexibility of as well as control over the presentation stimuli. Flexibility refers to the requirement that from each dataset a variety of images can be constructed, according to categories of the visual taxonomy. Control refers to the requirement that the stimuli be normalized by various psychophysical criteria so as not to bias a viewer. Each stimulus will be constructed as an example of a single, predominating taxonomical category, or as a hybrid of multiple categories. The data features underlying the graphics will be based on Zhou's extensive data taxonomy [
The PI is in communication with collaborator Dr. Zhou to also discuss the possibility of adapting their computer code used to generate visual stimuli [
these stimuli will be designed by PIIM staff or similar code will be written by the PI,
who has experience in programming graph-generation applications (in Matlab and in Python).
Stimulus presentation and behavioral measures
Hundreds of information graphics will be presented to each of at least 50 naïve subjects between 18 and 45 years old with normal or corrected-to-normal vision on a 21-inch color video monitor (CRT) using run-time, open source computer programs written with the aid of the Psychtoolbox (a Matlab toolbox that weds Matlab software to Macintosh hardware for precise and uninterrupted timing in perceptual cognitive experiments). During stimulus presentation, two types of subject responses will be recorded: oculomotor responses
(eye tracking data) for the existing and generated images and task-based responses
(mouse clicks or keyboard input) for the generated images.
The tasks will consist of answering questions about the images [
All behavioral data will be acquired at collaborator Dr. Vincent Ferrera’s laboratory at Columbia University, which conducts eye tracking and psychophysics research. All aspects of the experimental design will be made available on the PI’s website as well as described in publications and presented in lectures and at conferences.
Perhaps in a later stage of this work, subjects would answer questions about the relationships between image (fixation) points to see if these overt characterizations of images agree with the classifications of the taxonomy. An extension of this idea would be to create a web interface by which a large, distributed group of people could characterize these compositional relationships as part of a game [
Analysis
The eye tracking data will be analyzed by ISCAN software, and eye movement clustering will be performed using a mean shift procedure [
If we represent data-visual mappings as graphs as in [
The task-based responses will be evaluated for speed and accuracy to establish an expert group and a novice group for each task and for each information visualization method. Attempts will be made to correlate eye movement “signatures” with “expertise,” not in the sense of theoretically optimal eye movements [
One application of this expert vs. novice profiling is to automatically guide a novice to visually navigate an image in a similar manner as an expert, by carefully situating surprising elements [
III. A taxonomy of images based on composition of graphical elements
There have been numerous attempts at classifying images [
We will consider any two-dimensional image to be a set of graphical objects set in a space and spatially related to each other. We will build up our classification system from a set of graphical elements making up these objects, the linear transforms that situate them in a space, and relational operators for relating these objects to one another in this space.
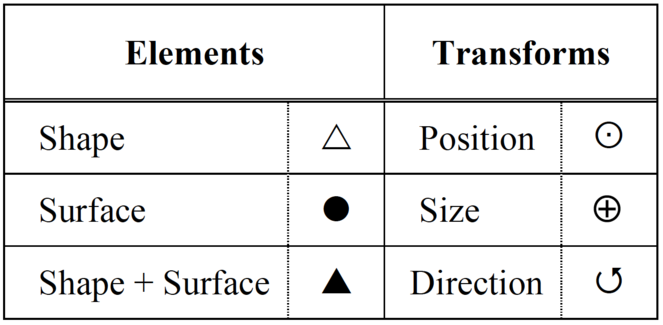
Our graphical elements will simply consist of shapes, which include curves and boundaries, and surfaces, the simple visual qualities of a surface such as colors and textures. We will consider graphical objects to consist of shapes enclosing surfaces.
Our graphical transforms are based on the affine transformations used in geometry and linear algebra, where any deformation to a shape is allowed so long as parallel lines remain parallel. Example transformations include translation and changes in scale and direction (rotation, reflection, and shear). Rather than consider the transformations themselves, we will consider the effects they have on graphical objects: position, size, and direction.
Finally, our relational operators are constructed from and act on the above elements and transforms (together referred to as attributes) or on each other, and will be of five general classes that we will refer to as connection, containment, composition, correspondence, and context. We will describe each relational operator below.
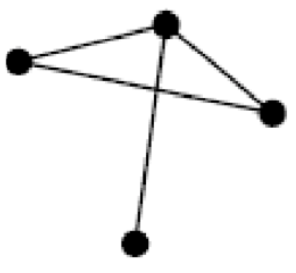
A graph provides perhaps the simplest way of relating two otherwise dissimilar objects in a diagram, by simply connecting them with an edge (
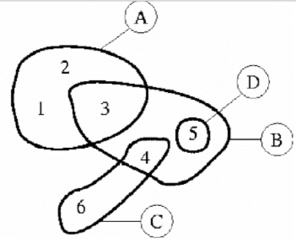
Composition refers literally to the case when one graphical element or operator is made up of other elements or operators, such as a texture made up of shapes. Mosaics are canonical examples of composition of graphical objects by other objects.
Correspondence refers instead to the case where a graphical property (element, transform, or relational operator) is a function of another property. An example is when a color contour plot uses color to indicate height along an axis perpendicular to the image plane; in the taxonomical nomenclature, color is a function of position. Functional relationships refer to either explicitly defined mathematical functions or visually apparent patterns or relationships for which no apparent function exists. Correspondence is usually defined in a key or legend.
Context means the space in which graphical objects are situated, and may be founded on a graphical element, a transform, and/or an operator. For example, an element such as color could define a space such as the C.I.E. color space, the position transform characterizes the Cartesian coordinate space, and the containment operator characterizes tabular space.
Symbolic notation
We will symbolically represent taxonomic classifications using the notation in
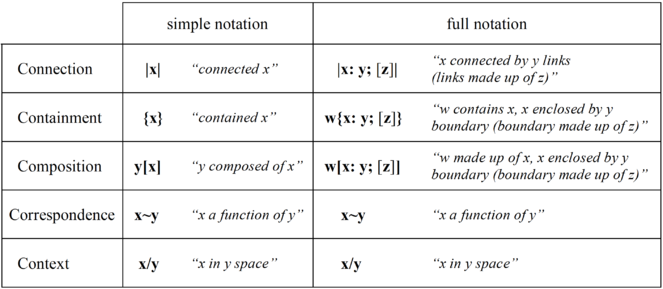
Relational operators - w, x, y, and z are all optional and refer to any attribute or operator
For example, a collection of right-facing arrows may collectively take the shape of a left-facing arrow or create a texture or provide a link between nodes in a network diagram, and so on. This substitution of one taxonomical category for another also allows for implicit forms of each, such as a texture boundary standing in for a curve. Taken further, any category may serve a symbolic role as well. For example, the color blue may be associated with "sky" or "water," an upper right orientation may be associated with "northeast," and a link connecting two pictures may create the impression of causal relation between the contents of the two. Because of the unlimited potential for applying semiotics to each of these categories, we will disregard the symbolic aspects of images for the purposes of classification. Taking shapes at face value creates one obvious dilemma, best exemplified by a treatment of text as graphical objects. Text functions to convey meaning apart from its form much as any visual is a symbol to be interpreted. Hereafter, text annotation is assumed to accompany almost every image and will not be incorporated in the taxonomy except in two cases: text as identifiers or as pointers, such as text labels identifying locations on a map and text pointing to another place in the image. In cases where text is the primary object, it may be denoted by "T" and where numbers are the primary objects, they may be denoted by "#," such as in a numerical table.
With regard to syntax, transform symbols usually precede element symbols and attribute symbols are sequentially ordered in a manner that conveys their successive application (such as symbols for position and scale for “positioned sizes” representing a Venn diagram of overlapping areas). Where symbols need to be clearly grouped together they are enclosed by parentheses; where they function independently they are separated by commas (such as the symbols for shape and surface to indicate that shapes and textures convey independent pieces of information, as in a scatter plot). Additionally, numerical superscripts are applied to disparate symbols in a notational string when they need to be identified as related or identical for clarity.
To summarize, the taxonomy has five general classes of relational operators (connection, containment, composition, correspondence, and context) that act on each other or on the following five properties of graphical objects: the elements shape and surface, and the transforms position, size, and direction. The conciseness and power of this taxonomy become apparent when applying combinations of the above properties to complex data visualizations. Distinctive, canonical forms of visual presentation are neatly distinguished from one another by these bottom-up classifications and are succinctly represented by the symbolic notation of
1. A curve is a one-dimensional continuous set of points such as a line segment or the outline of a shape.
2. A boundary is any visual property that implicitly marks the limit of an area or volume.
3. We will refer to textures in the manner of texture mapping and raytracing in computer graphics. Virtual light sources interact with surfaces exhibiting given optical properties. These surfaces are projected to two dimensions for viewing from a given perspective.
4. An affine transformation between two vector spaces consists of a linear transformation followed by a translation. Our transforms will sometimes deviate from affine transforms, for example when objects are scaled linearly with respect to basis vectors different than those of the image such as for radial plots. Another case is when the intent is to imply scale changes between objects, as in a caricature.
5. A graph is a mathematical construct formally relating different objects, and is depicted by a set of vertices connected by edges.
Biographical Sketch
ARNO KLEIN
Professional Preparation
University of Michigan (Ann Arbor) Biopsychology B.S., 1993
Massachusetts Institute of Technology Media Arts and Sciences M.S., 1996
(Spatial Imaging)
California Institute of Technology Computation & Neural Systems
Cornell Medical School Neuroscience Ph.D., 2005
Appointments
Information Synthesis Theorist
Parsons Institute for Information Mapping, The New School, NY 2005-present
Researcher in brain imaging at Columbia University, NY 2005
Publications (5)
Arno Klein, Brett Mensh, Satrajit Ghosh, Jason Tourville, and Joy Hirsch. 2005.
Mindboggle: Automated brain labeling with multiple atlases. BMC Medical Imaging. 5:7.
(http://www.biomedcentral.com/1471-2342/5/7/abstract)
Arno Klein and Joy Hirsch. 2005. Mindboggle: A scatterbrained approach to automate brain labeling. NeuroImage. 24(2): 261-280.
(http://www.binarybottle.com/mindboggle/downloads/mindboggle_neuroimage2005.pdf)
Arno Klein and Joy Hirsch. 2003. Mindboggle: new developments in automated brain labeling.
9th Annual Meeting for the Organization of Human Brain Mapping.
Arno Klein and Joy Hirsch. 2002. Fully-automated nonlinear labeling of human brain activity.
8th Annual Meeting for the Organization of Human Brain Mapping.
Arno Klein and Joy Hirsch. 2001. Automatic labeling of brain anatomy and fMRI brain activity.
7th Annual Meeting for the Organization of Human Brain Mapping.
Synergistic Activities (5)
1. Constructed a curriculum for an M.S. program in Information Mapping & Management,
and proposed it to the office of President Bob Kerrey of The New School.
2. Give lectures and demonstrations on data visualization and visualization ontologies to a
wide range of academic and government audiences. Recent examples include:
the National Academy of Sciences, the National Geospatial-Intelligence Agency,
the Office of the Director of National Intelligence, Columbia University, Baruch College,
The New School, and last year’s ESRI and GEOINT conferences.
3. Attend meetings and workshops that bring together scientists and artists; most recently,
participated in the “Science (Weather) Forecasts Workshop” at the Hall of Science in
New York (http://www.scimaps.org/meeting_061026.php).
4. Developing a new version of Mindboggle, open source software for automated anatomical
brain labeling, freely downloadable at http://www.binarybottle.com/mindboggle.html.
5. Actively developing three image databases, to be accessible online by the general public:
-
Data visualization
Intended to become the largest collection of manually annotated information graphics.
-
Cultural entomology
A collaboration with Barrett Klein of the University of Texas, Austin,
to disseminate knowledge about the interrelationships of insects and humans.
-
Cave temple architecture
Contains the first comprehensive photodocumentation of the Ellora cave temples in India, with thousands of manually annotated photographs taken by Arno Klein. This work was funded by a grant from the Mellon Foundation, and will result in a website with a “walk through” user interface to navigate through the images with respect to the temple ground plans, as well as a book, to be coauthored with Dr. Deepanjana Danda and
Professor Emeritus Walter Spink of the University of Michigan in Ann Arbor.
Collaborators and Co-Editors
Satrajit Ghosh, Ph.D., Postdoctoral Associate
Speech Communication Group, Research Laboratory of Electronics
Massachusetts Institute of Technology, Cambridge
Joy Hirsch, Ph.D., Director of the Functional MRI Research Center
Professor of Psychology and Functional NeuroRadiology
Departments of Radiology and Psychology, Center for Neurobiology and Behavior
Columbia University, New York
Brett Mensh, Ph.D., Assistant Clinical Professor
Department of Neuroscience, College of Physicians and Surgeons
Columbia University, New York
Jason Tourville, Ph.D. Candidate
Department of Cognitive and Neural Systems, Boston University, Boston
Graduate Advisors
Joy Hirsch (see Collaborators and Co-Editors)
Norman Relkin, Ph.D., M.D., Associate Professor of Clinical Neurology and Neuroscience
Weill Cornell Medical College, New York
Jonathon Victor, M.D., Ph.D., Professor, Department of Neurology and Neuroscience
Weill Cornell Medical College, New York
Thesis Advisor
Joy Hirsch (see Collaborators and Co-Editors)
Call
NSF: PD 03-7252 (1/15/2007) BCS - PERCEPTION, ACTION & COGNITION
Hosting institution
New School University
Ethics and security
Human Subjects Research
Protection of Human Subjects.
Human Subjects Involvement and Characteristics: Participants will be recruited from the Columbia Health and Sciences Campus and the Columbia Morningside Campus communities, as well as The New School community, with no biases toward race or gender. Participants will be included if they have normal visual acuity or corrected with contact lenses, are right handed, and have no history of neurological injury, disease, or developmental impairment, psychiatric illness, substance abuse, or hearing loss. The proposed research will involve both genders and a random sampling of races, with a total of 25-75 participants.
Sources of Materials: Data collected from participants will be used for research purposes only. It will be in the form of behavioral performance measuring accuracy on visual perception tasks, and reaction time in milliseconds, and eye movements for each trial. Behavioral data will be recorded and stored electronically as Matlab (.mat) files.
Potential Risks: The proposed studies will involve human subjects between the ages of 18 and 45. There are no known risks incurred by eye movement recording using infrared video oculography. This is a completely non-invasive method.
Protection Against Risks: All laboratory personnel have undergone extensive safety training as required by Columbia Presbyterian Hospital. Subjects are instructed that they may opt out of the study at any time.
Consent: All participants will complete the consent process upon arrival. During this time they will receive a written description of the study and the investigator will explain it in detail using non-technical language, including procedures. Potential risks and benefits of the current study will be explained. Participants will be informed that all measures required by the Internal Review Board will be taken to ensure confidentiality, such as keeping all identifying information in a locked file. All appropriate signatures and dates will be provided before any other procedures take place.
Potential Benefits to the participant: The benefits of participating in this study are not linked directly to the participant.
Potential Benefits to others: Participation in this research contributes directly to the fields of cognitive neuroscience and cognitive psychology, to teachers at all levels (with regard to the public availability of categorized information graphics used as stimuli), as well as to the general public interested in information graphics.
Women and Minority Inclusion: No exclusion criteria will be used regarding race or gender. We expect our testing to include identical numbers of males and females. The racial breakdown should reflect the racial characteristics of the very diverse local population.
Inclusion of Children: Because we are situated in a university environment, there is access to a potentially large subject population of at least 18 years of age. In order to ensure valid comparisons across subjects, we will require all participants to be of similar age, so unless we have access to a large enough subject pool younger than 18 to make statistically valid inferences, we will restrict the experimental subject pool for our first phase of experimentation to individuals 18 years or older.
Data and Safety Monitoring: We will safeguard the confidentiality of the study data and the identity of study subjects. We will use a unique code number for each subject. The data will only be identified by the codes and the key to the codes will be stored separately from the data. All information will be kept in locked file cabinets accessible only to the investigators. Electronic data files will be stored on computers that are not accessible to unauthorized personnel. The computers will be protected by PI’s HIPAA-compliant firewall. Whenever possible, files will be archived onto removable optical disks and erased from the hard drives of any active computers using a utility that completely wipes the file information. Any files that are transmitted over the network will be encrypted using a 128-bit key.
Author contributions
AK conceived of and wrote this proposal.
References
-
Labeling images with a computer game.Proceedings of the SIGCHI Conference on Human Factors in Computing SystemsCHI '04:319‑326. DOI: 10.1145/985692.985733
-
Semiology of Graphics.University of Wisconsin Press,Madison, WI.
-
A meta-taxonomy for diagram research. In: Anderson M, Meyer B, Olivier P (Eds)Diagrammatic Representation and Reasoning. London: Springer-Verlag.Springer-Verlag,London,109-123pp.
-
A taxonomy of visualization techniques using the data state reference model.Proc. of the IEEE Symp. on Information Visualization 2000 (InfoVis 2000).69-76pp. DOI: 10.1109/infvis.2000.885092
-
Building an ontology of visualization.589.Proc. of the Conf. on Visualization ‘04,7pp. DOI: 10.1109/visual.2004.10
-
Evaluating models of visual comprehension.Proc. of Eurocogsci '03, The European Cognitive Science Conference 2003115(6): .
-
A comparison of the readability of graphs using node-link and matrix-based representations.Proc. of the IEEE Symp. on Information Visualization1:17‑24. DOI: 10.1109/infvis.2004.1
-
Bayesian surprise attracts human attention.Advances in Neural Information Processing Systems (NIPS*2005).19.MIT Press,Cambridge, MA,1-8pp.
-
Classifying visual knowledge representations: a foundation for visualization research.Proc. of the 1st Conf. on Visualization ’90.131-138pp. DOI: 10.1109/visual.1990.146374
-
Automating the design of graphical presentations of relational information.ACM Trans. On Graphics5(2):110‑141. DOI: 10.1145/22949.22950
-
Modeling the effect of task and graphical representation on response latency in a graph reading task.Human Factors45(1):28‑45. DOI: 10.1518/hfes.45.1.28.27225
-
An architecture for rule-based visualization.Proc. Of the 4th Conf. on Visualization ’93.236-243pp. DOI: 10.1109/visual.1993.398874
-
Robust clustering of eye movement recordings for quantification of visual interest.Eye tracking research and applications (ETRA) Symp. 2004.2004.27-34pp. DOI: 10.1145/968363.968368
-
The eyes have it: a task by data type taxonomy for information visualizations.Proc. Of the 1996 IEEE Symp. On Visual Languages,336-343pp.
-
Rethinking visualization: a high-level taxonomy.Proc. of the IEEE Symp. on Information Visualization 2004 (InfoVis 2004).,10.1109/infvis.2004.59,151-158pp.
-
Understanding visualization through spatial ability differences.Proc. of IEEE Visualization (Vis 2005)511‑518. DOI: 10.1109/visual.2005.1532836
-
A problem-oriented classification of visualization techniques.Proc. Of the 1st Conference on Visualization ’90,139-143pp. DOI: 10.1109/visual.1990.146375
-
A taxonomy of visualization techniques for simulation in production and logistics. In: Chick S, Sánchez PJ, Ferrin D, Morrice DJ (Eds)Proc. of the 2003 Winter Simulation Conference.729-736pp. DOI: 10.1109/wsc.2003.1261489
-
The alignment framework for data visualization: relationships among research goals, data types, and multivariate visualization techniques.Annual Meeting of the American Psychological Society27:264‑271.
-
A representational analysis of relational information displays.Int. J. Human-Computer Studies45:59‑74. DOI: 10.1006/ijhc.1996.0042
-
Visual task characterization for automated visual discourse synthesis.Proc. of the CHI ’98,329-399pp. DOI: 10.1145/274644.274698
-
Building a visual database for example-based graphics generation.Proc. of the IEEE Symp. on Information Visualization 2002.23-30pp. DOI: 10.1109/infvis.2002.1173143
-
Applying machine learning to automated information graphics generation.IBM Systems Journal41(3):504‑523. DOI: 10.1147/sj.413.0504