|
Research Ideas and Outcomes :
Research Idea
|
|
Corresponding author: Lauren Q Rhee (lrhee@dietid.com)
Academic editor: Editorial Secretary
Received: 24 Jun 2021 | Accepted: 31 Aug 2021 | Published: 08 Sep 2021
© 2021 Adam Bernstein, Randall Moore, Lauren Rhee, Dina Aronson, David Katz
This is an open access article distributed under the terms of the Creative Commons Attribution License (CC BY 4.0), which permits unrestricted use, distribution, and reproduction in any medium, provided the original author and source are credited.
Citation:
Bernstein A, Moore RS, Rhee LQ, Aronson DL, Katz DL (2021) A digital dietary assessment tool may help identify malnutrition and nutritional deficiencies in hospitalized patients. Research Ideas and Outcomes 7: e70642. https://doi.org/10.3897/rio.7.e70642
|
|
Abstract
Malnutrition is common among hospitalized patients and associated with longer hospital stays, higher rates of rehospitalization, and increased mortality. Validated questionnaires of varying sensitivity and specificity to help identify patients at risk of malnutrition have been developed, but none has been broadly adopted. Tools to identify patients at risk for malnutrition should be quick, inexpensive, easy to administer and use, not require specialized nutrition knowledge, and provide results which can be entered into an electronic medical record; ideally, the tool should be deployed within 24 hours of admission and repeated if warranted. We hypothesize that a novel digital nutrition assessment tool which uses the Diet Quality Photo Navigation (DQPN) method, can help triage hospitalized patients toward further evaluation of nutritional status. We further propose that micronutrient deficiencies may be identified at the same time as malnutrition and that the reimbursement and cost savings from DQPN will prove substantially greater than the combined costs of its use and triggered dietitian consult. Deploying DQPN upon admission will represent an addition to standard hospital intake procedure that is frictionless for patients and health professionals, and one which may be overseen by clerical rather than clinical staff. The digital format of DQPN, which can be integrated into electronic medical records, will facilitate easier tracking and management of nutritional status over the course of hospitalization and post-discharge. To evaluate the hypotheses, DQPN will be deployed in a hospital setting to a group of patients who will also be seen by a registered dietitian to assess the nutritional status of each patient. Receiver operating characteristic curves will determine the point, or criterion, at which maximal true positivity rate and least false positivity rate for a diagnosis of malnutrition and specific nutrient deficiencies align. The study cohort will also be compared to a matched historical cohort to compare total medical spend and reimbursement between the intervention cohort and matched control. Testing of these hypotheses will thus allow for insight into whether DQPN may be used to identify malnutrition and nutrient deficiencies in hospitalized patients and, in so doing, improve patient outcomes, reduce healthcare utilization, and bring financial benefit to hospitals.
Keywords
malnutrition; nutritional deficiency; hospital; Diet Quality Photo Navigation; health care costs; digital health
Overview and background
Malnutrition is common among hospitalized patients and associated with longer hospital stays, higher rates of rehospitalization, and increased mortality (
Despite the health burden, malnutrition remains undiagnosed in up to 70% of patients (
Malnutrition is typically defined as any nutrition imbalance that affects both overweight and underweight patients and appears as either “undernutrition” or “overnutrition” (
All told, malnutrition accounts for nearly 12% of aggregate hospital costs (
Clinicians should be thus able to identify patients with, or at risk for, malnutrition in the hospital - upon admission, during the hospital stay, and at discharge. Tools to identify patients at risk for malnutrition should be quick, inexpensive, easy to administer and use, not require specialized nutrition knowledge, and provide results which can be entered into an electronic medical record (EMR); ideally the tool should be deployed within 24 hours of admission and repeated at intervals as warranted (
Objectives
We put forth a set of related hypotheses:
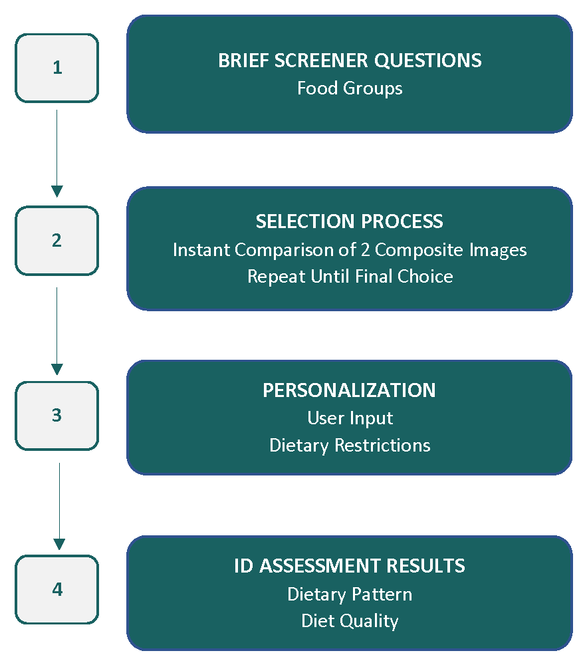
(1) We hypothesize that a novel digital nutrition assessment tool, Diet ID (www.dietid.com), which uses the Diet Quality Photo Navigation (DQPN) method (Fig.
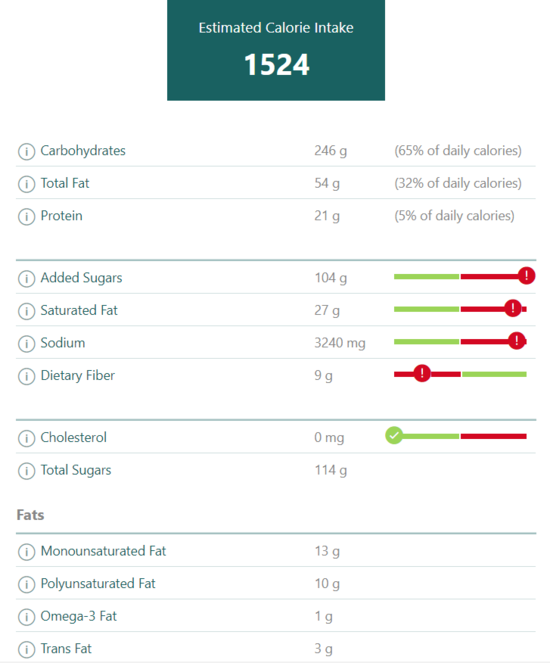
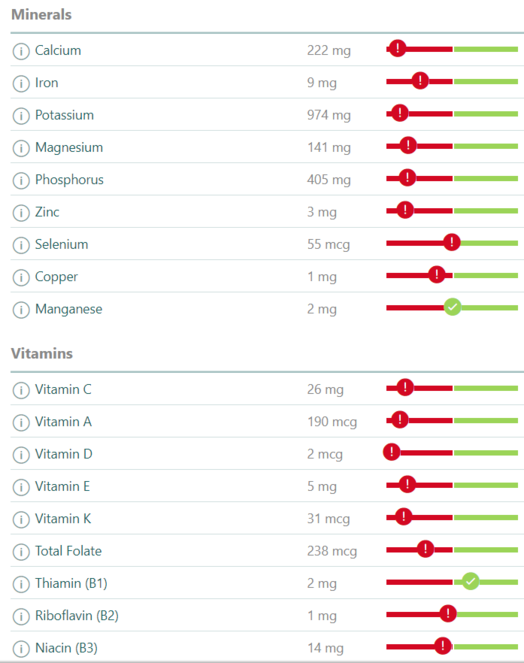
(2) As a secondary hypothesis, we propose that micronutrient deficiencies may be identified at the same time as other forms of malnutrition and that this more complete picture of nutritional status will allow for a range of dietary interventions (Fig.
(3) As a tertiary hypothesis, we propose that the reimbursement (in this case, money paid by the government, acting as insurer, to the hospital for services provided to a beneficiary) and cost savings from DQPN will prove substantially greater than the combined costs of its use and triggered dietitian consult. In support of this hypothesis, we estimate that the cost of DQPN (as little as $1 per assessment) and dietitian evaluation (varies by state, payer, and institution but would be expected to be less than $40 per patient encounter as that is Medicare reimbursement rate for medical nutrition therapy) (
Impact
Deploying DQPN upon admission will represent an addition to standard hospital intake procedure that may be frictionless for patient and health professional alike, and one which may be overseen by clerical rather than clinical staff. This is, in itself, a new way of thinking about the role of the hospital intake in collecting health-related information relevant to the admission. The digital format of DQPN, which can be integrated into electronic medical records (EMRs), will facilitate easier tracking and management of nutritional status over the course of hospitalization and post-discharge. This represents a new way of thinking about the role of the EMR, the type of data that should be stored in it, and the importance of nutrition in relation to health. Including a nutrition assessment tool, such as DQPN, as part of hospital admission reflects its evolution from use in the outpatient setting - where it may replace food frequency questionnaires, 24-hour recalls, and food records - to the inpatient one. As such, by deploying DQPN in a hospital setting, we are looking to impact not only patient care but also to transform elements of the health care delivery system.
Implementation
Diet ID technology
Diet ID, powered by DQPN, presents fully formed composite images of established dietary patterns and invites participants, or patients, to select the image most like their own current pattern of intake. The process is repeated until “best possible fit” is achieved. Pattern recognition is the basis for the DQPN method which is described in detail elsewhere (Katz et al. 2020). Diet ID includes the following mainstream dietary patterns: Standard American, Low-fat, Mediterranean, Pescatarian, Flexitarian, Low-carb (low carbohydrate), DASH (Dietary Approaches to Stop Hypertension), AHA (American Heart Association) Heart Healthy, TLC (Therapeutic Lifestyle Changes), MIND (Mediterranean-DASH Intervention for Neurodegenerative Delay), Vegetarian, Vegan, Paleo, and Southern, as well as a growing list of ethnic diets (e.g., Latin, South Asian, etc.). Diet quality is stratified among all diet types and is represented visually as well as quantitatively. Diet quality is objectively measured using the Healthy Eating Index (HEI) 2015, the most robustly researched and validated tool for measuring diet quality that correlates strongly with disease risk and projected healthcare costs (
Preliminary testing
In preliminary testing (
Evaluation of the hypothesis
To evaluate our hypothesis that Diet ID can screen for malnutrition and nutrient deficiencies in hospitalized patients, we will deploy the Diet ID technology in a hospital setting.
Triaging patients
Screening is by definition a test that look for disease before symptoms appear (
Deploying DQPN upon admission will represent an addition to standard hospital intake procedure that is frictionless for patient and health professional alike, and one which may be overseen by clerical rather than clinical staff. Information gathered during intake for admissions may include one’s name, address, telephone number, primary and secondary contact information, insurance and pharmacy information, contact information for one’s primary care physician (
Diagnosis
All 100 patients will be seen by a registered dietitian who will assess the nutritional status of the patient. Malnutrition is commonly diagnosed using either the American Society for Parenteral and Enteral Nutrition (ASPEN) (
Statistical approach
To evaluate our primary and secondary hypotheses, we will undertake the following steps. From Diet ID and the formal evaluation, receiver operating characteristic (ROC) curves will be generated to determine the point, or criterion, at which maximal true positivity rate and least false positivity rate for a diagnosis of malnutrition and specific micronutrient deficiencies align, including iron, zinc, thiamine, vitamin B12 and vitamin C. These points may be constructed using single outcome measures of interest from Diet ID, such as estimated energy intake, protein intake, or diet quality, or a combination. We expect that a combination ‘trigger’ of data can be identified that will have a sensitivity of 80% or higher and a specificity of 70% or higher. Separate ROC curves may be generated for prediction of micronutrient deficiencies. The following performance measures will also be assessed after determining the positivity criterion, as they depend on the selected criterion: sensitivity, specificity, positive predictive value, negative predictive, and false negative rate.
The sensitivity determination will be impacted by fact that there is no gold standard for a malnutrition diagnosis – health systems may independently choose to adopt ASPEN or GLIM criteria or a different criterion. The sample of consecutive patients chosen will impact sensitivity determinations; other sample populations may lead to different values and thus repeat assessments will be needed in other populations. A test with low reliability will generally not be very sensitive or specific (
To evaluate our third hypothesis, our study cohort will be compared to a matched historical cohort, similarly defined at the same institution, to determine the prevalence of diagnosed malnutrition in the historical control group. We anticipate that while malnutrition will be at a comparable prevalence in the matched controls, it will have gone completely overlooked. We will then compare total medical spend, and reimbursement between the intervention cohort and matched control using parametric or non-parametric tests as appropriate.
Discussion
In September of 2020, the American Heart Association issued a statement noting that It is “critical that diet quality be assessed and discussed at the point of care with clinicians and other members of the healthcare team to reduce the incidence and improve the management of diet-related chronic disease” (
Since 1995, the Joint Commission has mandated universal screening and assessment of hospitalized patients for malnutrition (
Current questionnaires deployed to identify malnutrition have failed to enter ‘standard of practice’ for reasons perhaps related to their performance, or more likely, challenges with integration into established workflow. A highly efficient, digital assessment amenable to patient use overseen by clerical rather than clinical staff, and integrated into an EHR, offers promise to overcome such impediments. Simple cohort studies can establish the clinical and economic benefits of such a system, while providing pilot data to make the case for randomized intervention trials. The goal of this line of inquiry would be to show that routine assessment and reliable identification of malnutrition, as well as possibly nutrient deficiencies, among hospitalized patients benefits both patients and healthcare systems.
Limitations
DQPN has been designed to reflect the general composition, objective quality, and approximate nutrient levels of a given diet, not to match exactly at the level of every food and nutrient (
It is possible that hospitalized patients may not have the interest, patience, motivation, or ability to use the DQPN tool as a result of their acute condition. As the tool is to be deployed at the same time as other admission paperwork, this too is expected to occur infrequently, and hospital staff will determine appropriateness of deploying the tool given each individual patient’s acuity. It is possible that patients may have questions or technological difficulties using DQPN; to date, this has occurred rarely and, importantly, when testing the hypothesis, the tool will be deployed in such a way as to not increase clinician time, burden, or workload.
Additionally, although malnutrition is a reimbursable diagnosis, coded as either a CC or MCC, with Medicare, it only takes one to shift the DRG to “with CC” or “with MCC” and therefore adding just one MCC will maximize reimbursement (
Conclusion
We have previously put forth evidence for pattern recognition through DQPN as an entirely new way to assess diet (
Ethics and security
Consent statement/Ethical approval: Not required.
Author contributions
AMB drafted the initial version of this manuscript and edited subsequent versions. DLA and LQR participated directly in the development of the Diet ID platform and reviewing/editing drafts of the manuscript. RSM is a board member of Diet ID and reviewed/edited drafts of this manuscript. DLK invented diet quality photo navigation and reviewed/edited drafts of this manuscript.
Conflicts of interest
AMB, LQR, DLA, and DLK are employees of Diet ID and own options or stock in the company. RM owns stock in Diet ID.
References
- Effect of micronutrient supplements on influenza and other respiratory tract infections among adults: a systematic review and meta-analysis.BMJ Global Health6(1). https://doi.org/10.1136/bmjgh-2020-003176
-
Medicare Fee Schedule for RDNs – MNT and G-Codes. Accessed on: 2021-4-9.
- Statistical Brief #218. Healthcare Cost and Utilization Project (HCUP). www.hcup-us.ahrq.gov/reports/statbriefs/sb218-Malnutrition-Readmissions-2013.jsp. Accessed on: 2021-2-12.
- Statistical Brief #210. Healthcare Cost and Utilization Project (HCUP). www.hcup-us.ahrq.gov/reports/statbriefs/sb210-Malnutrition-Hospital-Stays-2013.jsp. Accessed on: 2021-2-12.
- Addressing Malnutrition in Cancer Care with Nutrition-Focused Quality Improvement Programs (QIPs) that Support Value-based Payment in the United States.Journal of Clinical Nutrition and Food Science3(1):48‑55.
- Oral nutritional support of older (65 years+) medical and surgical patients after discharge from hospital: systematic review and meta-analysis of randomized controlled trials.Clinical Rehabilitation27(1):19‑27. https://doi.org/10.1177/0269215512445396
- Malnutrition Universal Screening Tool. https://www.bapen.org.uk/pdfs/must/must_full.pdf. Accessed on: 2021-2-15.
- Coding for Malnutrition in the Hospital: Does It Change Reimbursement?Nutrition in Clinical Practice34(6):823‑831. https://doi.org/10.1002/ncp.10426
- To screen or not to screen for adult malnutrition?Clinical Nutrition24(6):867‑884. https://doi.org/10.1016/j.clnu.2005.03.004
- A Longitudinal Assessment of Diet Quality and Risks Associated with Malnutrition in Socioeconomic and Racially Diverse Adults.Nutrients11(9):2046. https://doi.org/10.3390/nu11092046
- Development of a valid and reliable malnutrition screening tool for adult acute hospital patients.Nutrition15(6):458‑464. https://doi.org/10.1016/s0899-9007(99)00084-2
- Improving Malnutrition Documentation Enhances Reimbursement.Journal of the American Dietetic Association95(4):468‑475. https://doi.org/10.1016/s0002-8223(95)00123-9
- Malnutrition coding 101: financial impact and more.Nutrition in Clinical PracticeDec;28(6):698-709.https://doi.org/10.1177/0884533613508788
- Prospective associations of poor diet quality with long-term incidence of protein-energy malnutrition in community-dwelling older adults: the Health.American Journal of Clinical Nutrition107(2):155‑164. https://doi.org/10.1093/ajcn/nqx020
- GLIM Criteria for the Diagnosis of Malnutrition: A Consensus Report From the Global Clinical Nutrition Community.Journal of Parenteral and Enteral Nutrition43(1):432‑440. https://doi.org/10.1002/jpen.1440
- Patient Registration. https://www.hopkinsmedicine.org/patient_care/patients-visitors/admission-discharge/registration.html. Accessed on: 2021-3-25.
- Dietary assessment can be based on pattern recognition rather than recall.Medical Hypotheses140(109644). https://doi.org/10.1016/j.mehy.2020.109644
- Applications of the Healthy Eating Index for Surveillance, Epidemiology, and Intervention Research: Considerations and Caveats.Journal of the Academy of Nutrition and Dietetics118(9):1603‑1621. https://doi.org/10.1016/j.jand.2018.05.020
- Nutritional risk screening (NRS 2002): a new method based on an analysis of controlled clinical trials.Clinical Nutrition22(3):321‑336. https://doi.org/10.1016/s0261-5614(02)00214-5
- Update of the Healthy Eating Index: HEI-2015.Journal of the Academy of Nutrition and Dietetics118(9):1591‑1602. https://doi.org/10.1016/j.jand.2018.05.021
- Development and validation of a hospital screening tool for malnutrition: the short nutritional assessment questionnaire (SNAQ©).Clinical Nutrition24(1):75‑82. https://doi.org/10.1016/j.clnu.2004.07.015
- Malnutrition in hospitals.The British Medical Journal336(7639):290‑290. https://doi.org/10.1136/bmj.39449.723090.80
- Prepare for your visit — Billing and insurance matters. https://www.mayoclinic.org/patient-visitor-guide/billing-insurance/before-arrival/patient-checklist. Accessed on: 2021-3-25.
- Protein and energy supplementation in elderly people at risk from malnutrition.Cochrane Database of Systematic Reviews(2). https://doi.org/10.1002/14651858.CD003288.pub3
- Diet Quality as Assessed by the Healthy Eating Index, Alternate Healthy Eating Index, Dietary Approaches to Stop Hypertension Score, and Health Outcomes: A Second Update of a Systematic Review and Meta-Analysis of Cohort Studies.Journal of the Academy of Nutrition and Dietetics120(12):1998‑2031. https://doi.org/10.1016/j.jand.2020.08.076
- Comparison of five malnutrition screening tools in one hospital inpatient sample.Journal of Clinical Nursing20:2144‑2152. https://doi.org/10.1111/j.1365-2702.2010.03667.x
- A guide to completing the Mini Nutritional Assessment – Short Form (MNA®-SF).https://www.mna-elderly.com/forms/mna_guide_english_sf.pdf. Accessed on: 2021-2-15.
- Nutrition Screening and Assessment in Hospitalized Patients: A Survey of Current Practice in the United States.Nutrition in Clinical Practice29(4):483‑490. https://doi.org/10.1177/0884533614535446
- Evaluation of the Healthy Eating Index-2015.Journal of the Academy of Nutrition and Dietetics118(9):1622‑1633. https://doi.org/10.1016/j.jand.2018.05.019
- Modern Epidemiology, 2nd edition.Lippincott Williams & Wilkins,Philadelphia. https://doi.org/10.1097/00001648-199805000-00019
- Prevalence of Malnutrition Risk and the Impact of Nutrition Risk on Hospital Outcomes: Results From nutritionDay in the U.S.Journal of Parenteral and Enteral Nutrition43(7):918‑926. https://doi.org/10.1002/jpen.1499
- Health Economic Evaluation Modeling Shows Potential Health Care Cost Savings with Increased Conformance with Healthy Dietary Patterns among Adults in the United States.Journal of the Academy of Nutrition and Dietetics119(4):599‑616. https://doi.org/10.1016/j.jand.2018.10.002
- Adult Malnutrition (Undernutrition) Screening: An Evidence Analysis Center Systematic Review.Journal of the Academy of Nutrition and Dietetics120(4):669‑708. https://doi.org/10.1016/j.jand.2019.09.010
- The facilitated early enteral and dietary management effectiveness trial in hospitalized patients with malnutrition.Journal of Parenteral and Enteral Nutrition35(2):209‑216. https://doi.org/10.1177/0148607110392234
- Emergency Services Patient Information. https://about.stlukeshealth.org/services-specialties/emergency-care/er-patient-registration-form#. Accessed on: 2021-3-25.
- Critical role of nutrition in improving quality of care: an interdisciplinary call to action to address adult hospital malnutrition.Journal of the Academy of Nutrition and Dietetics113(9):1219‑1237. https://doi.org/10.1016/j.jand.2013.05.015
- Health Screening. https://medlineplus.gov/healthscreening.html. Accessed on: 2021-2-20.
- Rapid Diet Assessment Screening Tools for Cardiovascular Disease Risk Reduction Across Healthcare Settings: A Scientific Statement From the American Heart Association.Circulation. Cardiovascular Quality and Outcomes13(9):e000094. https://doi.org/10.1161/HCQ.0000000000000094
- Consensus statement: Academy of Nutrition and Dietetics and American Society for Parenteral and Enteral Nutrition: characteristics recommended for the identification and documentation of adult malnutrition (undernutrition).Journal of Parenteral and Enteral Nutrition26(3):275‑283. https://doi.org/10.1177/0148607112440285