|
Research Ideas and Outcomes :
Project Report
|
|
Corresponding author: Quentin Groom (quentin.groom@plantentuinmeise.be)
Received: 26 Aug 2020 | Published: 28 Aug 2020
© 2020 David Owen, Quentin Groom, Alex Hardisty, Thijs Leegwater, Laurence Livermore, Myriam van Walsum, Noortje Wijkamp, Irena Spasić
This is an open access article distributed under the terms of the Creative Commons Attribution License (CC BY 4.0), which permits unrestricted use, distribution, and reproduction in any medium, provided the original author and source are credited.
Citation: Owen D, Groom Q, Hardisty A, Leegwater T, Livermore L, van Walsum M, Wijkamp N, Spasić I (2020) Towards a scientific workflow featuring Natural Language Processing for the digitisation of natural history collections. Research Ideas and Outcomes 6: e58030. https://doi.org/10.3897/rio.6.e58030
|
|
Abstract
We describe an effective approach to automated text digitisation with respect to natural history specimen labels. These labels contain much useful data about the specimen including its collector, country of origin, and collection date. Our approach to automatically extracting these data takes the form of a pipeline. Recommendations are made for the pipeline's component parts based on state-of-the-art technologies.
Optical Character Recognition (OCR) can be used to digitise text on images of specimens. However, recognising text quickly and accurately from these images can be a challenge for OCR. We show that OCR performance can be improved by prior segmentation of specimen images into their component parts. This ensures that only text-bearing labels are submitted for OCR processing as opposed to whole specimen images, which inevitably contain non-textual information that may lead to false positive readings. In our testing Tesseract OCR version 4.0.0 offers promising text recognition accuracy with segmented images.
Not all the text on specimen labels is printed. Handwritten text varies much more and does not conform to standard shapes and sizes of individual characters, which poses an additional challenge for OCR. Recently, deep learning has allowed for significant advances in this area. Google's Cloud Vision, which is based on deep learning, is trained on large-scale datasets, and is shown to be quite adept at this task. This may take us some way towards negating the need for humans to routinely transcribe handwritten text.
Determining the countries and collectors of specimens has been the goal of previous automated text digitisation research activities. Our approach also focuses on these two pieces of information. An area of Natural Language Processing (NLP) known as Named Entity Recognition (NER) has matured enough to semi-automate this task. Our experiments demonstrated that existing approaches can accurately recognise location and person names within the text extracted from segmented images via Tesseract version 4.0.0.
We have highlighted the main recommendations for potential pipeline components. The paper also provides guidance on selecting appropriate software solutions. These include automatic language identification, terminology extraction, and integrating all pipeline components into a scientific workflow to automate the overall digitisation process.
Keywords
automated text digitisation, natural language processing, named entity recognition, optical character recognition, handwritten text recognition, language identification, terminology extraction, scientific workflows, natural history specimens, label data
1.Introduction
1.1 Background
We do not know how many specimens are held in the world's museums and herbaria. However, estimates of three billion seem reasonable (
Perhaps the method most widely used today to extract these data from labels is for expert technicians to type the specimen details into a dedicated collection management system. They might, at the same time, georeference specimens where coordinates are not already provided on the specimen label. Volunteers have often been recruited to help with this process and, in some cases transcription has been outsourced to companies specializing in document transcription (
Nevertheless, human transcription of labels is slow and requires both skill to read the handwritten labels and knowledge of the names of places, people, and organisms. These labels are written in many languages often in the same collection and sometimes on the same label. Furthermore, abbreviations are frequently used and there is little standardisation on where each datum can be found on the label.
Full or partial automation of this process is desirable to improve the speed and accuracy of data extraction and to reduce the associated costs. Automating even the simplest tasks such as triaging the labels by language or writing method (typed versus handwritten) stands to improve the overall efficiency of the human-in-the-loop approach. Optical Character Recognition (OCR) and Natural Language Processing (NLP) are two technologies that may support automation. OCR aims to convert images of text into a machine-readable format (
OCR and NLP proved effective for extracting data from biodiversity literature (
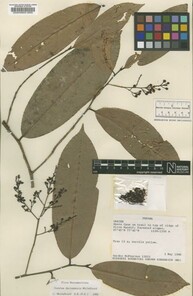
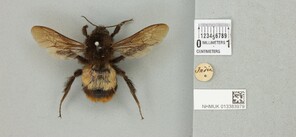
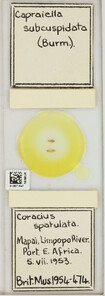
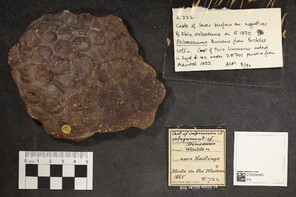
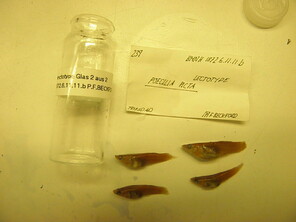
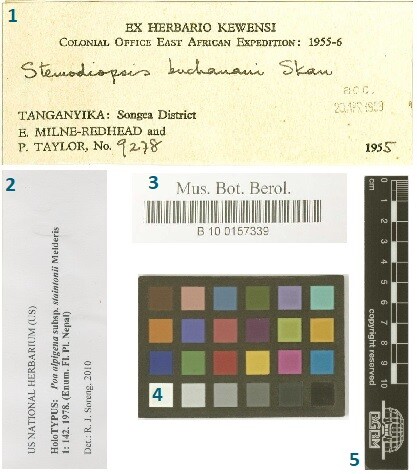
A range of specimens that demonstrate the wide taxonomic range of specimens encountered in collections. They also demonstrate the diversity of label types, which include handwritten, typed, and printed labels. Note the presence of various barcodes, rulers, and a colour chart in addition to labels describing the origin of the specimen and its identity.
b: Pinned insect specimen (
c: Microscope slide (
d: Fossilised animal skin (
e: Liquid preserved specimen (
This paper examines the state of the art in automated text digitisation with respect to specimen images. The recommendations within are designed to enhance the digitisation and transcription pipelines that exist at partner institutions. They are also intended to provide guidance towards a proposed centralised specimen enrichment pipeline that could be created under a pan-European Research Infrastructure for biodiversity collections (
In this paper, we focus mainly on herbarium specimens, even though similar data extraction problems exist for pinned insects, liquid collections, and animal skins. Herbarium specimens are among the most difficult targets and we know from recent successful pilot studies for large-scale digitisation such as Herbadrop (
1.2 Digitisation Workflow
We now outline a potential digitisation workflow, which is designed to process specimens and extract targeted data from them (Fig.
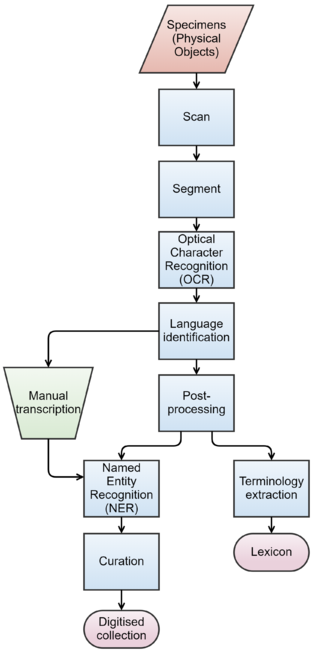
To make these text documents searchable by the type of information that they contain, another layer of information (metadata) is required on top of the original text. This step requires deeper analysis of the textual content, which is performed using NLP including language identification, Named Entity Recognition (NER), and terminology extraction. The role of language identification here is twofold. If the labels are to be transcribed manually, then language identification can help us direct transcription tasks to the transcribers with suitable language skills. Similarly, if the labels were to be processed automatically, then the choice of tools will also depend on the given language.
NER will support further structuring of the text by interpreting relevant portions of the text, such as those referring to people and locations. In addition to the extracted data and the associated metadata, the digitised collection should also incorporate a terminology that facilitates the interpretation of the scientific content described in the specimens. Many specimen labels contain either obscure or outdated terminology. Therefore, standard terminologies need to be supplemented by terminology extracted from the specimens.
Finally, the performance of both OCR and NLP can be improved by restricting their view to only the labels on the specimen. This can be achieved by segmenting images prior to processing by identifying the areas of the image that relate to individual labels. However, there are trade-offs between the time it takes to segment images compared to the improved performance of OCR and NLP. In a production environment processing time is limited because of the need to ingest images into storage from a production line through a pipeline that includes quality control, the creation of image derivatives, and image processing.
To help determine the subsequent steps in the pipeline it may be necessary to establish the language of the text recognised in the OCR step. This next step may be the deployment of language-specific NLP tools to identify useful information in the target specimen. Or it may be the channelling of the text for manual transcription. A number of software solutions exist for performing language identification and are explored in section 3.3.
An approach to automatic identification of data from OCR recognised text might include NER. This is an NLP task that identifies categories of information such as people and places. This approach may be suitable for finding a specimen's collector and collection country from text. Section 3.4 investigates this possibility using an NER tool.
1.3 Project Context
This project report was written as a formal Deliverable (D4.1) of the ICEDIG Project and was previously made available on Zenodo (
2. Data
2.1 Data Collection
As noted above there is a large body of digitised herbarium specimens available for experimentation. A herbarium is a collection of pressed plant specimens and associated data (Fig.
Each partner herbarium contributed 200 images containing a geographical and temporal cross-section of nomenclatural type and non-type herbarium specimens (Fig.
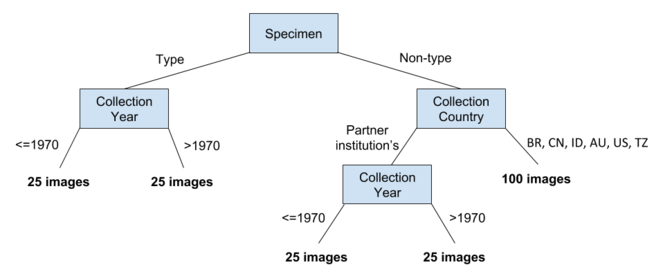
A total of nine herbaria, described in Table
Contributing institutions and their codes from Index Herbariorum.
| Institution | Index Herbariorum Code | ICEDIG Partner |
|---|---|---|
|
Naturalis Biodiversity Center, Leiden, Netherlands |
L | Yes |
|
Meise Botanic Garden, Meise, Belgium |
BR | Yes |
|
University of Tartu, Tartu, Estonia |
TU | Yes |
|
The Natural History Museum, London, United Kingdom |
BM | Yes |
|
Muséum national d'Histoire naturelle (MNHN), Paris, France |
P | Yes |
|
Royal Botanic Gardens, Kew (RGBK), Richmond, United Kingdom |
K | Yes |
|
Finnish Museum of Natural History, Helsinki, Finland |
H | Yes |
|
Botanic Garden and Botanical Museum, Berlin, Germany |
B | No |
|
Royal Botanic Garden Edinburgh, United Kingdom |
E | No |
2.2 Data Properties
To illustrate the textual content of these images and to better understand the challenges posed to the OCR, Fig.
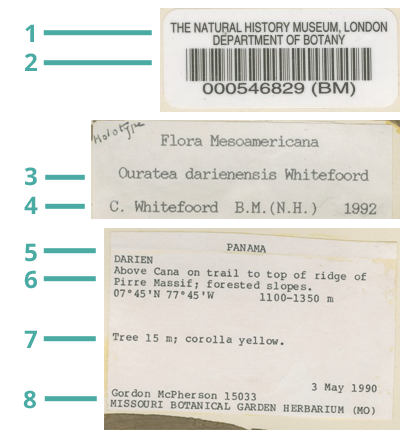
- Title: Organisation that owns the specimen.
- Barcode: The specimen's machine readable identifier.
- Species name: Scientific or common name of the species.
- Determined by and date: The person who identified the specimen and the date of identification.
- Locality: The geographical location where the specimen was collected.
- Habitat and altitude: The habitat in which the specimen was collected and its altitude.
- Notes: Additional notes written by the collector, often related to the characters of the species.
- Collector name, specimen number, and collection date: The name of the person(s) who collected the specimen, the identifier that they used to record and manage specimens, and the date that the specimen was collected.
The above list is non-exhaustive and more or less information may be recorded by the collector or determiner.
The properties of textual content of the given herbarium have been extrapolated from a random sample of 10 specimens per institution (Table
A summary of specimen properties. The Names and Index Herbariorum codes for the contributing herbaria are listed in Table
|
Contributor |
Words Per Specimen |
Handwritten Content |
|
BR |
47 |
49.0% |
|
H |
77 |
21.3% |
|
P |
45 |
42.3% |
|
L |
64 |
22.0% |
|
BM |
59 |
32.8% |
|
B |
61 |
50.1% |
|
E |
54 |
68.0% |
|
K |
79 |
17.8% |
|
TU |
26 |
62.2% |
|
Average |
57 |
40.6% |
A subset of 250 images with labels written in English has been selected to test the performance of image segmentation and its effects on OCR and NER. For the purposes of these tests these images were manually divided into a total of 1,837 label segments, which were then processed separately.
The segments effectively separate labels, barcodes, and colour charts. Examples can be seen in Fig.
2.3 Metadata
The role of OCR is to convert image text into searchable text. To make this text searchable by the type of information that they contain, another layer of information (metadata) is required on top of the original text. We can differentiate between three different types of metadata (
- Descriptive metadata facilitate searching using descriptors that qualify their content. For example, digitised specimens can be accessed by a species name, its collection location, or its collector.
-
Structural metadata describe how the components of the data object are organised thereby facilitating navigation through its content. For example, labelling each segment of a digitised specimen by its type can facilitate their management. As shown in Fig.
5 , segment types include colour chart, ruler, barcode, collector's label, and determination. - Administrative metadata convey technical information that can be used to manage data objects. Examples include time of creation, digital format, and software used.
While metadata can take many forms, it is important to comply with a common standard to improve accessibility to the data. Darwin Core (
The problem of populating a predefined template such as the one defined by Darwin Core with information found in free text is an area of NLP known as Information Extraction (IE) (
3. Digitisation Experiments
This section describes a selection of software tools that can be used to automate the steps of the digitisation workflow shown in Fig.
3.1 Optical Character Recognition
OCR is a technology that allows the automatic recognition of characters through an optical mechanism or computer software (
We tested three off-the-shelf OCR software tools, described in Table
|
Founded Year |
Latest Stable Version |
License |
Windows |
Macintosh |
Linux |
|
|
Tesseract |
1985 |
4.0.0 |
Apache |
Windows 10 |
Mac OS X 10.14.x |
Ubuntu 18.04, 18.10 |
|
ABBYY FineReader Engine |
1989 |
12.0 |
Proprietary |
Windows 10, 8.1, 8, 7-SP1 |
Mac OS X 10.12.x, 10.13.x |
Ubuntu 17.10, 16.04.1, 14.04.5 |
|
Microsoft OneNote |
2012 |
17.10325.20049 |
Proprietary |
Windows 10, 8.1 |
Mac OS X, 10.12 or later |
Ubuntu 18.04, 18.10 |
Microsoft's OneNote is a note-taking and management application for collecting, organising, and sharing digital information (
To evaluate the OCR performance of the aforementioned software tools, we ran two sets of experiments, one against the whole digital images of specimens and the other against the segmented images with an expectation that the latter would result in shorter processing time and higher accuracy. Indeed, the results shown in Table
|
Processing Time (h:m:s) |
||||
|
250 Whole Images |
1,837 Segments |
Difference |
Difference (Percentage Saving) |
|
|
Tesseract 4.0.0 |
01:06:05 |
00:45:02 |
-00:21:03 |
-31.9% |
|
Tesseract 3.0.51 |
00:50:02 |
00:23:17 |
-00:26:45 |
-53.5% |
|
ABBYY FineReader Engine 12.0 |
01:18:15 |
00:29:24 |
-00:48:51 |
-62.4% |
The accuracy of OCR will be measured in terms of line correctness as described by
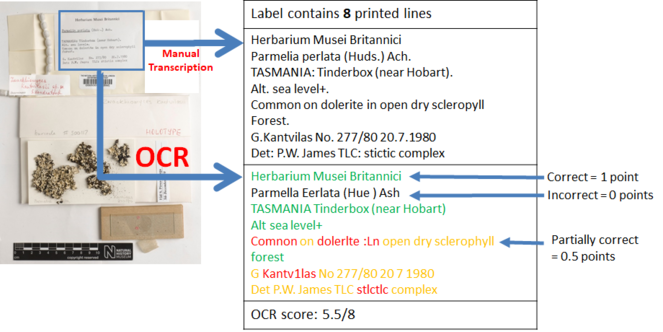
Bearing in mind the time and effort involved in creating the gold standard, only a subset of the dataset (250 specimen images and their segments) available for testing was used to evaluate the correctness of the OCR. Five herbarium sheet images, their segments and manual transcriptions, and OCR text used in these experiments can be found in Section 2 of Suppl. material
|
5 Whole Images Mean Line Correctness (%) |
22 Segments Mean Line Correctness (%) |
Difference |
|
|
Tesseract 4.0.0 |
72.8 |
75.2 |
+2.4 |
|
Tesseract 3.0.51 |
44.1 |
63.7 |
+19.6 |
|
ABBYY FineReader Engine 12.0 |
61.0 |
77.3 |
+16.3 |
|
Microsoft OneNote 2013 |
78.9 |
65.5 |
-13.4 |
Apart from ABBYY FineReader Engine all other tools recorded an accuracy around 70%, with Tesseract 4.0.0 proving to be the most robust with respect to image segmentation. Its performance could be improved by further experiments focusing on its configuration parameters.
3.2 Handwritten Text Recognition
As mentioned in section 1.1, not all specimen labels bear printed text. A huge volume of specimen labels bear handwritten text in place of or in addition to printed text. Similar to using OCR to automatically read printed specimen labels, we can use Handwritten Text Recognition (HTR) to automatically read handwritten specimen labels. HTR is described as the task of transcribing handwritten text into digital text (
ABBYY FineReader Engine 12.0 and Google Cloud Vision OCR v1 (
We performed an experiment to measure the HTR performance of both ABBYY FineReader Engine and Google Cloud Vision with respect to handwritten specimen labels. The five specimen whole images used in section 3.1 were reused in this experiment. These whole images, each of which bear handwritten text, were submitted to ABBYY FineReader Engine and Google Cloud Vision to undergo HTR.
The HTR results from ABBYY FineReader Engine and Google Cloud Vision were compared against the gold standard for each specimen image using Levenshtein distance (
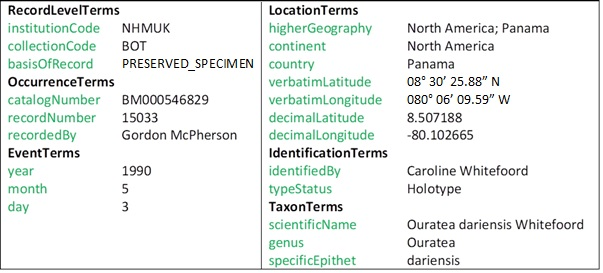
One must be cautious when comparing interpreted gold standard data. For example, where the catalog number is "BM000521570" Google Cloud Vision finds "000521570 (BM)". Technically, Google Cloud Vision has found the correct string, but because the gold standard contains an interpreted value it appears that Google Cloud Vision is not correct. Another example concerns the fact that the gold standard contains fields that use abbreviations, such as country codes. This means that "Australia" and its country code "AU" will rightly be considered identical.
Specific fields were identified for HTR analysis: catalogNumber, genus, specificEpithet, country, recordedBy, typeStatus, verbatimLocality, verbatimRecordedBy. Verbatim coordinates are likely too complex or too often open to interpretation to be compared reliably in this analysis. For example, verbatimEventDate was ignored because it is not technically verbatim; it may be written “3/8/59” on a specimen label, but recorded as “1959-08-03” in a specimen database (
Note that typeStatus is not always present in a specimen image. It is therefore often inferred based on other data that is present. It was nevertheless included in the analysis because of its importance in biodiversity taxonomy.
Fig.
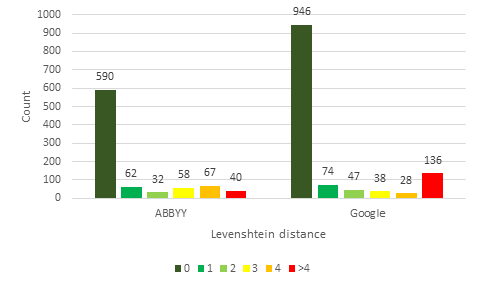
Examining the results in Fig.
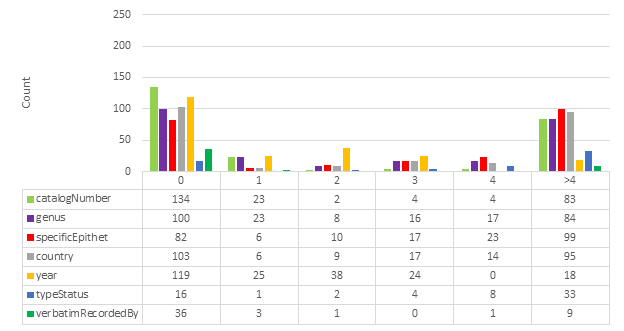
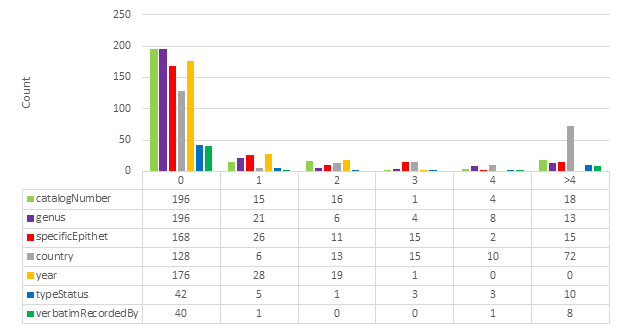
In conclusion, this comparative test indicates that the results from Google Cloud Vision are of higher quality than ABBYY FineReader Engine. The results are of even higher quality when the lowest scoring categories are excluded. These results demonstrate that HTR can be used to retrieve a considerable volume of data of high quality. HTR should no longer be dismissed as ineffective because it has already become a viable technique.
3.3 Language Identification
Language identification is the task of determining the natural language that a document is written in. It is a key step in automatic processing of real-world data where a multitude of languages exist (
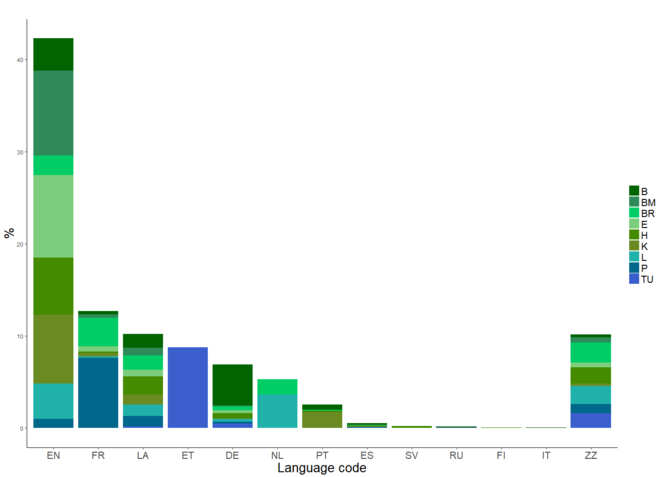
The distribution of languages across the specimen and herbaria. EN=English, FR=French, LA=Latin, ET=Estonian, DE=German, NL=Dutch, PT=Portuguese, ES=Spanish, SV=Swedish, RU=Russian, FI=Finnish, IT=Italian, ZZ=Unknown. The codes for the contributing herbaria are listed in Table
A number of off-the-shelf software tools can be used to perform language identification, examples of which can be seen in Table
|
Software |
Licence |
Organisation |
|
langid.py |
Open Source |
University of Melbourne |
|
langdetect |
Apache License Version 2.0 |
N/A |
|
language-detection |
Apache License Version 2.0 |
Cybozu Labs, Inc. |
Table
Example of langid.py usage with fragments of OCR text. Output lines denote the language identified in the input text and the probability estimate for the language.
|
Input: “Unangwa Hill about 6 km. E. of Songea in crevices in vertical rock faces” Output: English [99%] |
|
Input: “Herbier de Jardin botanique de l'Etat” Output: French [99%] |
|
Input: “Tartu olikooli juures oleva loodusuurijate seltsi botaanika sekstsiooni” Output: Estonian [99%] |
|
Input: “Arbusto de ca. 2 m, média ramificação.” Output: Portuguese [100%] |
The program language-detection (
3.4 Named Entity Recognition
NER is commonly used in information extraction to identify text segments that refer to entities from predefined categories (
As mentioned in section 2.3, in this study we are interested in two categories of named entity: country (part of the location) and collector (a specific person). Pre-trained NER software can only identify names of locations and persons, but cannot verify that a location is a country or that a person is a collector. Therefore, we will generalise our NER problem into that of recognising persons and locations in general and will accordingly measure the performance of Stanford NER on our dataset. A subset of specimen labels were manually transcribed and annotated with person and location labels to create a gold standard against which to evaluate Stanford NER. Fig.
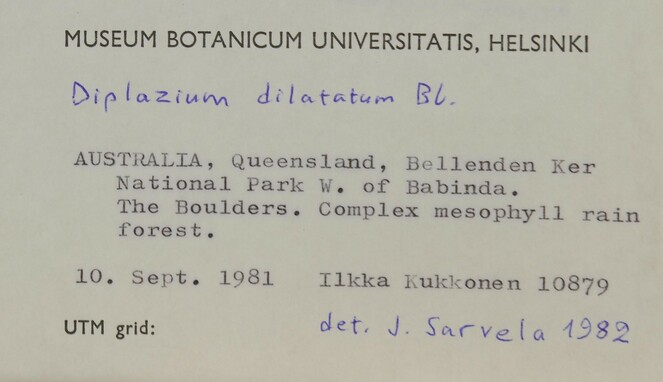
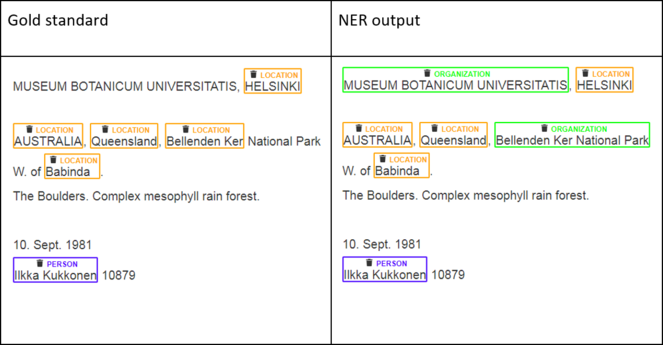
According to
- Both boundaries of a named entity and its type match. For example, the segment “Ilkka Kukkonen” in Fig.
13 is recognised fully and correctly as a person. - Two text segments overlap partially and match on the type.
Either way, the NER results are usually evaluated using the three most commonly used measures in NLP: precision, recall, and F1 score. In the context of NER, precision is the fraction of automatically recognised entities that are correct, whereas recall is the fraction of manually annotated named entities that were successfully recognised by the NER system. F1 score is a measure that combines precision and recall - it is the harmonic mean of the two.
Table
|
Predicted (NER) |
|||
| Negative | Positive | ||
|
Actual (Gold Standard) |
Negative |
True Negative |
False Positive |
|
Positive |
False Negative |
True Positive |
|
Formulae for Precision, Recall, and F1 Score:
\(Precision = {\text{True Positive} \over \text{True Positive} + \text{False Positive}}\)
\(Recall = {\text{True Positive} \over \text{True Positive} + \text{False Negative}}\)
\(F1Score= 2*{\text{Precision}*\text{Recall} \over \text{Precision} + \text{Recall}}\)
To evaluate the performance of NER on our dataset, we selected a subset of five herbarium sheet images and their segments, which are to be found in Section 3 of Suppl. material
Table
|
PERSON |
LOCATION |
Overall |
|
|
Precision |
0.81 |
0.38 |
0.69 |
|
Recall |
0.71 |
0.21 |
0.53 |
|
F1 |
0.76 |
0.27 |
0.60 |
|
PERSON |
LOCATION |
Overall |
|
|
Precision |
0.85 |
0.43 |
0.74 |
|
Recall |
0.74 |
0.50 |
0.69 |
|
F1 |
0.79 |
0.46 |
0.71 |
An improvement across all measures can be observed when using OCR text from segmented images. This is consistent with the increased line correctness observed described in section 3.1.
3.5 Terminology Extraction
To improve the accessibility of a specimen collection, its content needs to be not only digitised but also organised in alphabetical or some other systematic order. This is naturally expected to be done by species name. The problem with old specimens is that the content of their labels is not likely to comply with today's standards. Therefore, matching them against existing taxonomies will fail to recognise non-standard terminology. To automatically extract species names together with other relevant terminology, we propose an unsupervised data-driven approach to terminology extraction. FlexiTerm is a method developed in-house at Cardiff University. It has been designed to automatically extract multi-word terms from a domain-specific corpus of text documents (
OCR text extracted from specimens in a given herbarium fits a description of a domain-specific corpus; therefore FlexiTerm can exploit linguistic and statistical patterns of language use within a specific herbarium to automatically extract relevant terminology. Section 4 of Suppl. material
4. Putting It All Together
Many scientific disciplines are increasingly data driven and new scientific knowledge is often gained by scientists putting together data analysis and knowledge discovery “pipelines” (
A scientific workflow consists of a series of analytical steps. These can involve data discovery and access, data analysis, modelling and simulation, and data mining. Steps can be computationally intensive and therefore are often carried out on high‐performance computing clusters. Herbadrop, a pilot study of specimen digitisation using OCR, demonstrated successful use of high performance digital workflows (
The tools that allow scientists to compose and execute scientific workflows are generally known as workflow management systems, of which Apache Taverna and Kepler are among the most well-known and best established examples.
Apache Taverna is open-source and domain-independent (
Taverna was successfully deployed within the domain of biodiversity via BioVeL - a virtual laboratory for data analysis and modelling in biodiversity (
Taverna supported BioVeL users by allowing them to create workflows via a visual interface as opposed to writing code. Users were presented with a selection of processing steps and can “drag and drop” them to create a workflow. They could then test the workflow by running it on their desktop machine before deploying it to more powerful computing resources.
Kepler is a scientific workflow application also designed for creating, executing and sharing analyses across a broad range of scientific disciplines (
Like Taverna, Kepler provides a graphical user interface to aid in the selection of analytical components to form scientific workflows (
Tools like Apache Taverna and Kepler can be used for creating workflows for OCR, NER, and IE, like that depicted in Fig.
5. Conclusions
We designed a modular approach for automated text digitisation with respect to specimen labels (Fig.
|
Task |
Software |
Comment |
|
Optical Character Recognition |
Tesseract 4.0.0 |
Robust with respect to image segmentation |
|
Handwritten Text Recognition |
Google Cloud Vision |
Supports 56 languages |
|
Language identification |
langid.py |
Supports 97 languages |
|
Named Entity Recognition |
Stanford NER |
A wide variety of entities recognised including location, organisation, date, time, and person |
|
Terminology extraction |
FlexiTerm |
Robust with respect to orthographic variations (such as those introduced by OCR) |
6. Appendices
For the sake of brevity the appendices can be found in the supplementary document "Appendices". The document contains the following principal information concerning the Digitisation Experiments:
- OCR Software Settings
- OCR Line Correctness Analysis Data
- NER Analysis Data
- Non-standard Terminology Extraction Analysis Data
7. Glossary
- Automated text digitisation - The process of converting written text to a machine-readable format, that allows text to become searchable. In biodiversity, documents can typically include printed or handwritten specimen labels.
- Conditional Random Field - A machine learning method for structural pattern recognition; in particular, sequence labelling. For example, an unnamed image containing part of a leaf can appear in a sequence of plant specimen images. A machine may be able to determine that the leaf belongs to a "deciduous holly" if a named image of that plant neighbours the leaf image in the sequence.
- Deep learning - A type of machine learning based on neural networks. It is widely used in both image processing and natural language processing to support end-to-end learning by simultaneously training all parameters and representing them by a single model. This makes manual feature engineering redundant.
- Gold standard - A dataset used to evaluate a computational model. The gold standard is often produced by manual data annotation. In the task of automated text digitisation of a specimen label a human transcribes the label. This forms a reference against which the model to digitise the labels automatically can be tested.
- Handwritten Text Recognition (HTR) - Automated digitisation of hand-written text.
- High performance computing cluster - This approach to computing involves multiple co-located computer processors working alongside one another in parallel to complete a task.
- Information Extraction (IE) - The task of extracting information from unstructured text into a predefined template. For example, information contained in a specimen label can be extracted and structured into a Darwin Core record.
- JPEG - A compressed format for computer image files, designed to make them easy to store and to send between computers.
- Language identification - The task of automatically classifying a natural language a document is written in i.e., English, Spanish, etc.
- Machine learning - The process of generalising available data into a computational model that can then be used to make inferences on unseen data. For example, a computer may have learnt that leaves of the holly species of plant contain several pointed ends if it has observed many such images in the past. If the computer later sees an image of a rounded leaf it may determine that the leaf is unlikely to be the holly species.
- Metadata - Typically described as data about data. Metadata consist of structured information that describes, explains, locates or otherwise makes it easier to find, access and use the underlying data. A digital photograph of a plant specimen is data. This photograph may be accompanied by additional information such as the date and time the photograph was taken, the name of the camera used, and the resolution of the image. This is metadata.
- Named Entity Recognition (NER) - A subtask of information extraction focusing on named entities, such as persons, countries, cities and organisations.
- Natural Language Processing (NLP) - A wide range of tasks and methods used to automatically analyse information expressed in a natural language.
- Optical Character Recognition (OCR) - The process of converting images of text, such as a photograph of a specimen label into a machine-readable format.
- Scientific workflow - The description of a process in terms of a sequence of steps (tasks and sub-tasks) that must be completed, generally with computer assistance to meet some research goal. A workflow might include the digitisation, acquisition, and curation of specimen label data using a sequence of steps that involves OCR and NLP methods.
Grant title
ICEDIG – “Innovation and consolidation for large scale digitisation of natural heritage”, Grant Agreement No. 777483
Author contributions
Authors
David Owen: Data Curation, Formal Analysis, Methodology, Software, Writing - Original Draft. Quentin Groom: Funding acquisition, Resources, Writing - Original Draft, Supervision. Alex Hardisty: Funding acquisition, Supervision, Writing - Original Draft. Thijs Leegwater: Formal analysis, Methodology. Laurence Livermore: Validation, Writing - review and editing. Myriam van Walsum: Formal analysis, Methodology, Writing - Original Draft. Noortje Wijkamp: Formal analysis, Methodology. Irena Spasić: Conceptualisation, Methodology, Funding acquisition, Supervision, Writing - Original Draft.
Contributors
Mathias Dillen: Resources, Visualisation. Sarah Phillips: Methodology, Resources. Zhengzhe Wu: Resources.
Contribution types are drawn from CRediT - Contributor Roles Taxonomy.
References
-
AI-powered OCR SDK for Windows, Linux & Mac OS | ABBYY OCR API. https://www.abbyy.com/en-gb/ocr-sdk. Accessed on: 2018-11-21.
-
Kepler: an extensible system for design and execution of scientific workflows.Proceedings. 16th International Conference on Scientific and Statistical Database Management, 2004.423‑424. https://doi.org/10.1109/ssdm.2004.1311241
-
Language identification: the long and the short of the matter. In:Human Language Technologies: The 2010 Annual Conference of the North American Chapter of the Association for Computational.Los Angeles, California. URL: https://www.aclweb.org/anthology/N10-1027
-
Workflows and extensions to the Kepler scientific workflow system to support environmental sensor data access and analysis.Ecological Informatics5(1):42‑50. https://doi.org/10.1016/j.ecoinf.2009.08.008
-
Darwin Core. https://dwc.tdwg.org/. Accessed on: 2020-6-05.
-
langdetect.GitHub. URL: https://github.com/Mimino666/langdetect
-
Darwin Core.Zenodohttps://doi.org/10.5281/zenodo.592792
-
A benchmark dataset of herbarium specimen images with label data.Biodiversity Data Journal7https://doi.org/10.3897/bdj.7.e31817
-
Distributed System of Scientific Collections. https://www.dissco.eu/. Accessed on: 2020-5-30.
-
Weight Annotation in Information Extraction.155.23rd International Conference on Database Theory (ICDT 2020),Copenhagen,30th March-2nd April, 2020.Schloss Dagstuhl – Leibniz-Zentrum für Informatik,Dagstuhl.Leibniz International Proceedings in Informatics (LIPIcs),155,18pp. [ISBN978-3-95977-139-9]. https://doi.org/10.4230/LIPIcs.ICDT.2020.8
-
The use of Optical Character Recognition (OCR) in the digitisation of herbarium specimen labels.PhytoKeys38:15‑30. https://doi.org/10.3897/phytokeys.38.7168
-
Worldwide Engagement for Digitizing Biocollections (WeDigBio): The Biocollections Community's Citizen-Science Space on the Calendar.BioScience68(2):112‑124. https://doi.org/10.1093/biosci/bix143
-
An Evaluation of In-house versus Out-sourced Data Capture at the Meise Botanic Garden (BR).Biodiversity Information Science and Standards2https://doi.org/10.3897/biss.2.26514
-
EUDAT & Herbadrop Collaboration. https://www.eudat.eu/eudat-herbadrop-collaboration. Accessed on: 2018-10-08.
-
Suomen Lajitietokeskus. http://id.luomus.fi/EIG.6494. Accessed on: 2018-12-22.
-
Detect Text (OCR). https://cloud.google.com/vision/docs/ocr. Accessed on: 2018-12-22.
-
Tesseract OCR. https://opensource.google.com/projects/tesseract. Accessed on: 2018-10-22.
-
BioVeL: a virtual laboratory for data analysis and modelling in biodiversity science and ecology.BMC Ecology16(1). https://doi.org/10.1186/s12898-016-0103-y
-
D4.2 - Automating data capture from natural history specimens | SYNTHESYS3. http://synthesys3.myspecies.info/node/695. Accessed on: 2018-10-21.
-
The flora phenotype ontology (FLOPO): tool for integrating morphological traits and phenotypes of vascular plants.Journal of Biomedical Semantics7(1). https://doi.org/10.1186/s13326-016-0107-8
-
Handbook of Natural Language Processing.2nd.Chapman and Hall/CRC,New York. [ISBN9780429149207] https://doi.org/10.1201/9781420085938
-
Evaluating and Combining Name Entity Recognition Systems.Proceedings of the Sixth Named Entity Workshophttps://doi.org/10.18653/v1/w16-2703
-
Binary codes capable of correcting deletions, insertions and reversals.Soviet physics doklady10(8):707‑710.
-
Scientific Workflows.ACM Computing Surveys49(4):1‑39. https://doi.org/10.1145/3012429
-
Scientific workflow management and the Kepler system.Concurrency and Computation: Practice and Experience18(10):1039‑1065. https://doi.org/10.1002/cpe.994
-
langid. py: An off-the-shelf language identification tool. In:Proceedings of the ACL 2012 System Demonstrations.Jeju Island, Korea,July 2012.Association for Computational LinguisticsURL: https://www.aclweb.org/anthology/P12-3005
-
Microsoft OneNote. http://www.onenote.com/?404&public=1. Accessed on: 2018-11-22.
-
Optical character recognition.1.Wiley-Interscience[ISBN978-0471308195]
-
A survey of named entity recognition and classification.Benjamins Current Topics3‑28. https://doi.org/10.1075/bct.19.03nad
-
Ouratea dariensis Whitef. https://data.nhm.ac.uk/object/be595f07-73c5-4764-a96c-8b377e3d1507/1586822400000. Accessed on: 2020-4-15.
-
Zwackhiomyces kantvilasii Kondr. https://data.nhm.ac.uk/object/dfdbbcd3-bcb3-460c-bbb0-6330b2505439/1586822400000. Accessed on: 2020-4-14.
-
Dinosauria Owen, 1841. https://data.nhm.ac.uk/object/eb6b1ad8-6c16-437c-859e-cd505c4e321f/1586822400000. Accessed on: 2020-4-15.
-
Poecilia picta Regan, 1913. https://data.nhm.ac.uk/dataset/collection-specimens/resource/05ff2255-c38a-40c9-b657-4ccb55ab2feb/record/625771. Accessed on: 2020-5-08.
-
Capraiella Conci, 1941. https://data.nhm.ac.uk/object/c65d9a3c-d8f6-4fac-a418-05c3b697cece/1586822400000. Accessed on: 2020-4-15.
-
Bombus (Orientalibombus) haemorrhoidalis Smith, F.https://data.nhm.ac.uk/object/745febc7-8222-498a-9969-5f6b12f85ef3/1586822400000. Accessed on: 2020-4-15.
-
Use of Semantic Segmentation for Increasing the Throughput of Digitisation Workflows for Natural History Collections.Biodiversity Information Science and Standards3https://doi.org/10.3897/biss.3.37161
-
Tesseract 4 is here! State of the art OCR in R!https://ropensci.org/technotes/2018/11/06/tesseract-40/. Accessed on: 2018-12-20.
-
Methods for Automated Text Digitisation.Zenodohttps://doi.org/10.5281/zenodo.3364502
-
Biological collections and ecological/environmental research: a review, some observations and a look to the future.Biological Reviews85(2):247‑266. https://doi.org/10.1111/j.1469-185x.2009.00098.x
-
Understanding Metadata: What is Metadata, and What is it For?: A Primer.National Information Standards OrganizationURL: https://www.niso.org/publications/understanding-metadata-2017 [ISBN978-1-937522-72-8]
-
Handwritten text recognition in historical documents.Vienna University of Technology,Vienna. URL: https://repositum.tuwien.ac.at/obvutwhs/content/titleinfo/2874742
-
language-detection. https://github.com/shuyo/language-detection. Accessed on: 2018-10-31.
-
FlexiTerm: a flexible term recognition method.Journal of Biomedical Semantics4(1). https://doi.org/10.1186/2041-1480-4-27
-
Acronyms as an Integral Part of Multi-Word Term Recognition – A Token of Appreciation.IEEE Access6:8351‑8363. https://doi.org/10.1109/access.2018.2807122
-
The Value of Museum Collections for Research and Society.BioScience54(1):66‑74. https://doi.org/10.1641/0006-3568(2004)054[0066:tvomcf]2.0.co;2
-
Apache Taverna. https://taverna.incubator.apache.org/. Accessed on: 2018-10-21.
-
Applications of Natural Language Processing in Biodiversity Science.Advances in Bioinformatics2012:1‑17. https://doi.org/10.1155/2012/391574
-
Stanford Named Entity Recogniser (NER). https://nlp.stanford.edu/software/CRF-NER.shtml. Accessed on: 2018-10-20.
-
Mapping the biosphere: exploring species to understand the origin, organization and sustainability of biodiversity.Systematics and Biodiversity10(1):1‑20. https://doi.org/10.1080/14772000.2012.665095
-
Darwin Core: An Evolving Community-Developed Biodiversity Data Standard.PLoS ONE7(1). https://doi.org/10.1371/journal.pone.0029715
Supplementary material
For the sake of brevity the Appendices can be found in this supplementary document. The document contains the following principal information concerning the Digitisation Experiments:
- OCR Software Settings
- OCR Line Correctness Analysis Data
- NER Analysis Data
- Non-standard Terminology Extraction Analysis Data