|
Research Ideas and Outcomes :
Research Article
|
|
Corresponding author: Stephanie Walton (s.walton@nhm.ac.uk), Laurence Livermore (l.livermore@nhm.ac.uk)
Received: 06 Jul 2020 | Published: 07 Jul 2020
© 2020 Stephanie Walton, Laurence Livermore, Mathias Dillen, Sofie De Smedt, Quentin Groom, Anne Koivunen, Sarah Phillips
This is an open access article distributed under the terms of the Creative Commons Attribution License (CC BY 4.0), which permits unrestricted use, distribution, and reproduction in any medium, provided the original author and source are credited.
Citation: Walton S, Livermore L, Dillen M, De Smedt S, Groom Q, Koivunen A, Phillips S (2020) A cost analysis of transcription systems. Research Ideas and Outcomes 6: e56211. https://doi.org/10.3897/rio.6.e56211
|
|
Abstract
We compare different approaches to transcribing natural history data and summarise the advantages and disadvantages of each approach using six case studies from four different natural history collections. We summarise the main cost considerations when planning a transcription project and discuss the limitations we current have in understanding the costs behind transcription and data quality.
Keywords
natural history collections, cost analysis, transcription, specimen digitisation, label information, crowdsourcing, automation
1. Introduction
Natural History (NH) collections are a critical infrastructure for meeting the most important challenge humans face – creating a sustainable future for ourselves and the natural systems on which we depend – and for answering fundamental scientific questions about ecological, evolutionary, and geological processes.
In order to use collections to address these challenges, we need to have both human- and machine- readable data. Data about NH specimens remain largely human readable and only accessible physically, by looking at corresponding handwritten, typed or printed labels or registers. While digitisation rates of NH specimens have increased in the last decade (
There are four different approaches to specimen data transcription: (1) direct manual transcription into institutional collections management systems (CMS) or spreadsheets; (2) crowdsourcing using online platforms like Atlas of Living Australia's Digivol, DoeDat, and Notes from Nature; (3) outsourced transcription to a specialised commercial company like the Dutch Alembo; and (4) automated or semi-automated methods like optical character recognition (OCR) or hand-written text recognition (HTR). The majority of institutions rely on the first method and some have experimented with the others. While automated solutions continue to slowly develop, manual input and crowdsourcing are the primary transcription methods.
While the differences in timing per specimen for each of these methods may vary only by a matter of seconds, these differences increase exponentially when applied to thousands of specimens. Thus the impact of subtle changes in workflow, the inclusion of certain outputs like geolocation or taxonomic resolution, the skill and experience level of transcribers, and the accuracy of the transcription quickly accumulate and may have a significant impact on the cost of digitising an entire collection.
All links referenced in this report were archived using the Internet Archive's Wayback Machine save page service on 06-07-2020.
1.1 Scope
Due to the numerous factors that impact the pace and cost of transcription, direct comparisons cannot be made between different methods (
An evaluation of these different methods leads to a series of recommendations and considerations for institutions that are considering different approaches to transcription. Due to limitations in collecting accurate cost comparison data, this report does not offer explicit benchmarks on how much transcription can be expected to cost - this will vary for each institution based on a host of factors discussed. However sample costs for different methods and workflows are presented where available in the context of subtle changes and operational efficiencies that will have an impact on time and, ultimately, cost.
1.2 Project Context
This project report was written as a formal Deliverable (D4.5) of the ICEDIG Project and was previously made available to project partners and submitted to the European Commision as a report. While the differences between these versions are minor the authors consider this the definitive version of the report.
2. Transcription Cost Considerations
2.1 Information and workflow
The time and costs associated with the different transcription methods can vary greatly based on two sets of factors. The two sets of factors - information and workflow - need to be managed regardless of which of the four methods (manual, crowdsourcing, outsourced or automated) are employed.
2.1.1 Information and Data Standards
The primary considerations when approaching transcription are the amount of information on the specimen’s label, the difficulty of reading this label information (e.g. handwriting or damage), and the level of interpretation required to create usable data from verbatim data (e.g. for georeferencing). The speed and accuracy of transcribing primary data are influenced by the level of expertise of the transcriber and their knowledge of the subject matter.
The scope of data to be transcribed can also vary widely, with smaller collections tending to complete more fields while larger collections lean towards minimal “skeletal” or “stub” records, identifying higher priority specimens to fully transcribe later. If using the same methodology, the costs of creating records with less data are lower than those with more data. There are currently no agreed standards for the level of data capture expected in the digitisation process, although a new standard has been proposed within the ICEDIG project: ‘Minimum Information about a Digital Specimen (MIDS)’ (
2.1.2 Workflow
The secondary factor is the workflow established for the transcription process. Some collections are barcoded, imaged and transcribed at the same time while others are done in phases, with barcoding and imaging occurring first and then a digitiser returning to the specimen later to transcribe the labels from the images. In some cases, transcription is broken out into further phases with basic information like UID (unique identifier) and taxonomy entered first and then more detailed collector and geographic information transcribed later. This phased approach is often taken when the physical organisation of the collection and sorting of specimens effectively encodes useful metadata about the specimens, most commonly taxonomy but sometimes geography, collector and other data. The speed of the workflow is influenced by the level of automation available in assigning details like UIDs and location names as well as the design of a CMS and the number of steps required to create a new item within the software.
2.2 Transcription interpretation
Both
- Verbatim transcription: the literal information as found on the label;
- Interpreted transcription - any additional meaning, corrections and normalisation made to the literal label data.
Some CMSs and institutions include fields for both verbatim and interpreted data, leaving it to data users to make assessments of the data later. A majority of digitisation projects include some degree of data interpretation which has the benefit of making data more useful for research, data aggregation, findability and linkage
2.3 Staff experience level
The quality of data transcription, particularly if labels are difficult to read and some level of interpretation is required, can vary greatly depending on the experience of the transcriber. A majority of institutions in this study rely on in-house staff with some, if not extensive, experience specifically in the taxa and geographic regions they are digitising.
In a study comparing the quality of georeferencing between experts and volunteers,
2.4 Automation
Semi-automation and automation can also play a significant role in both the time and cost of digitisation. Optical character recognition (OCR) has been shown to be effective for biodiversity literature but is only in the earliest stages of application to biodiversity labels, which may contain a number of complexities and nuances not found in literature. While manual transcription can account for minor issues like typos, OCR transcription is often entirely verbatim and cannot, at this point, be combined with higher-level interpretation such as aligning with Darwin Core standards, conducting complex georeferencing and parsing into specific database fields. Label transcription also often requires hand-written text recognition (HTR).
Multiple companies now provide online API-based OCR tools to extract and interpret text, such as Google’s Cloud Vision, Microsoft’s Azure Cognitive Services and IBM’s Watson. Platforms like Transkribus (
However, these tools are still being tested for efficiency, cost and accuracy (
2.5 Availability of cost data
An ICEDIG report to understand the costs of mass digitisation (
In the absence of comparable cost data, this report focuses on tactics for reducing the time taken for transcription, which ultimately drives cost.
3. Methodology
Without a set of established standards and a large sample of equally mature workflows, it was not possible to acquire truly comparable cost data that could be quantitatively analysed. Rather, we asked for available cases, either in the format of case studies, project reports or raw data, that covered any of the four transcription methods - OCR, crowdsourcing, outsourced or in-house manual transcription. We asked for descriptions of the following information:
-
Scope of data being transcribed (e.g. country, collector, taxon);
-
Software being used;
-
Transcription and/or georeferencing methodology;
-
Associated labour (e.g. staff time and approximate grade); and
-
Any other important considerations.
All seven collections-holding partners within the ICEDIG Project were surveyed and seven cases were returned (Table
Institution responses (from ICEDIG collection holding institutes) to calls for transcription cases grouped by transcription method. NB * and † indicate that these methods were used together in the same project (see the case studies).
| Institution | Manual | Crowdsourced | Outsourced | Automated |
| Meise Botanic Garden (MeiseBG) | 1* | 1* | 1* | 1 |
| Naturalis Biodiversity Center (NBC) | - | - | - | - |
| Royal Botanic Gardens, Kew (RBGK) | 1† | 1† | - | - |
| Finnish Museum of Natural History (Luomus) | 1 | - | - | - |
| Muséum national d'Histoire naturelle (MNHN) | - | - | - | - |
| University of Tartu (UTARTU) | - | - | - | - |
| Natural History Museum, London (NHMUK) | 2 | - | - | - |
4. Case Studies
4.1 NHMUK Pinned Insects
Bumblebees (Bombus sp.) and birdwing butterflies (Ornithoptera, Trogonoptera, and Troides) were digitised in two different pinned insect workflows but followed similar processes. The key difference is that the Bombus collection was georeferenced but the butterfly collection was not.
The digitisers who managed the transcription have prior experience with similar collection types but would refer questions on taxonomic or name resolutions to specific curators. The date range of the collections extended to the late 18th century and, as result, the labels included a mix of both handwritten and typed information.
4.1.1 Information and workflow
Digitisation was carried out in three phases - 1) imaging, 2) label transcription and 3) georeferencing. For Bombus, all specimens first went through phase 1 as a group, then all went through phase 2 and then went to phase 3. For the Birdwings, the collections were grouped into batches by genera and then taken as groups through the three phases.
In the first stage, labels were removed and placed next to the specimens and then the specimens were imaged. Files were renamed using an automated software with the specimen’s UID (from the barcode number) and taxonomy.
In the second phase, label data were manually transcribed from the images into an Excel spreadsheet. The spreadsheet was pre-populated with the UID and taxonomy collected in phase one by exporting it from the CMS and copying into the spreadsheet. The Bombus specimens were physically arranged based on taxonomy then by sex. The following information was transcribed:
-
Catalogue/Specimen and acquisition/registration numbers: These were captured verbatim based on what is on the label.
-
Locality: These data differed between the two collections. The Bombus project was a UK collection and locations were easily sourced from a master site that had been developed as part of the iCollections project. A dropdown list was available within the spreadsheet that contained the master sites from which a site could be selected. If a specimen’s locality was not in the master sites list, the locality was transcribed verbatim with only the country interpreted. (For these specimens, their verbatim localities were georeferenced in phase 3 following the transcription completion). For the butterflies collection, which did not originate in the UK, all of the information on the locality label were transcribed verbatim aside from the country which was interpreted.
-
Collection Date: Dates were transcribed verbatim, however, some exceptions were interpreted (month = roman numerals; year = last two digits etc). If a range was provided, the start and end dates were both entered into different columns.
-
Collectors: Initially transcribed verbatim and upon completion all entries with only initials were interpreted.
-
Type Status: Transcribed verbatim.
-
Sex: Sex was interpreted (♂ = male; ♀ = female etc).
-
Life Stage: Life stage was only available for butterflies and was interpreted.
-
Preparation: Preparation was only available for butterflies and was captured verbatim.
Georeferencing was only done for the Bombus collection because the research project required georeferencing data. However no georeferencing was done for butterflies.
4.1.2 Project Results
Results for both collections are in Table
4.1.3 Project Discussion
This case represents a standard example of a manual workflow that occurs in two phases - initial digitisation/imaging and then transcription. There was some slight automation with the ability to draw from a pre-existing list of UK locations, which may have saved some time. Also, while some of the cases were georeferenced, it was only a small portion of them and, as georeferencing tends to be the most time-consuming aspect of transcription, its absence in most cases may contribute to the short time of only approximately ~35 seconds per specimen.
4.2 NHMUK Herbarium Sheets
This collection consisted of approximately 10,000 Legume sheets, which were barcoded and imaged as part of a focused digitisation project. At the time of this study, approximately 3,000 of these were transcribed. The remaining non-transcribed specimens were used to conduct an analysis of the transcription workflow. Because of the mixed nature of the collection labels - some typed, some handwritten and some mixed - this collection provided a good case study on the time differences that can result from difficult-to-read labels.
The digitiser specifically chose specimens from the Tropical Africa region because they had no prior experience with the area and thus the speed of digitisation would be less impacted by familiarity bias. Drawing specimens from a similar locality would also make the digitisation process faster and more efficient.
4.2.1 Information and workflow
Two different methodologies were tested to assess the difference in timings. For Test 1, 100 specimens were selected, 50 of which were transcribed in full directly into the CMS and 50 of which were transcribed in full directly into Excel, which would later be uploaded into the CMS.
In Test 2, 100 different specimens were again selected, 50 of which went into the CMS and 50 of which went into Excel. However, transcription was broken out into two phases. In the first phase, only the collector, collection number and date were transcribed. Then in the second phase, the basic specimen transcriptions were grouped together by collector and collection date, thus pooling similar transcription needs together in order to improve the efficiency of georeferencing and further data input.
In a final Test 3, a third set of 100 specimens was selected and measured for the length of time to transcribe three different types of labels.
-
Handwritten labels were those where all the required information (collector, collection date, collection number and locality) was handwritten (Figs
1 ,2 ). -
Typed labels where all the required information (collector, collection date, collection number and locality) was all typed (Figs
3 ,4 ). -
Mixed labels were those where some information was typed, and some information was handwritten (Figs
5 ,6 ).
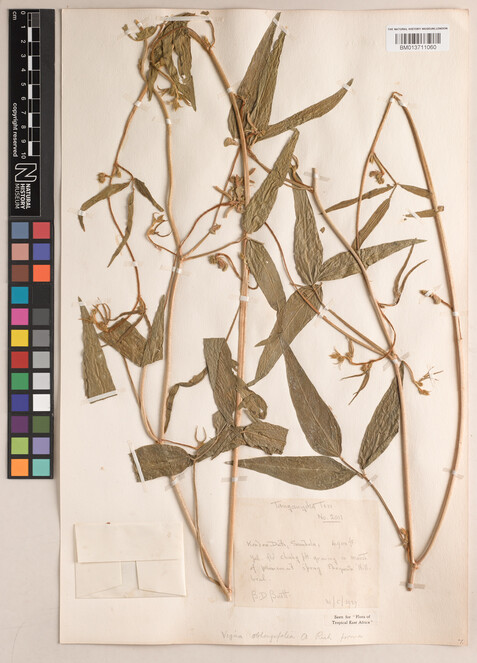
Specimen BM013711060 - Vigna oblongifolia A.Rich.
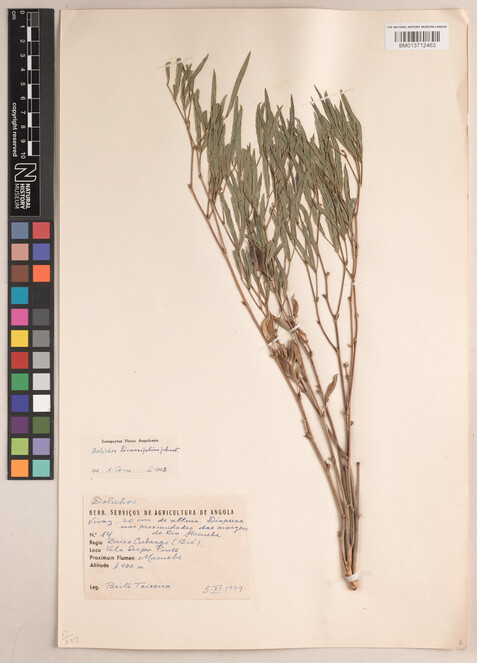
Specimen BM013712463 - Dolichos linearifolius I.M.Johnst.
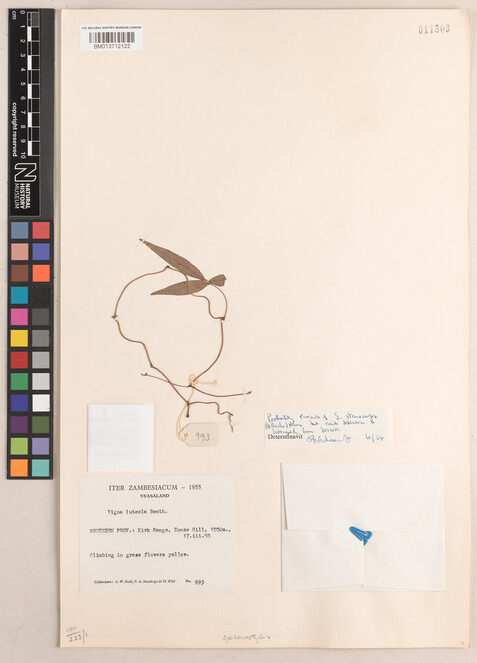
Specimen BM013712122 - Sphenostylis stenocarpa (Hochst. ex A.Rich.) Harms.
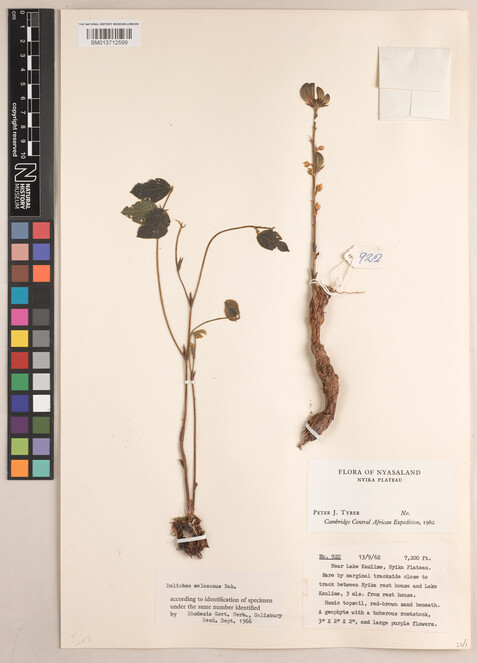
Specimen BM013712599 Dolichos kilimandscharicus var. kilimandscharicus.
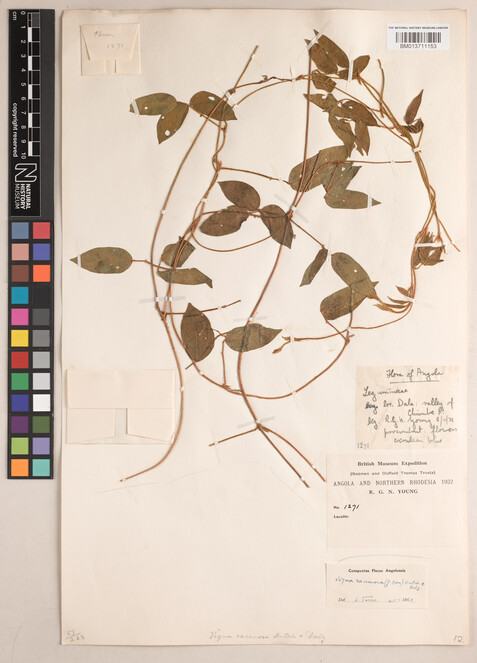
Specimen BM013711153 - Vigna racemosa (G.Don) Hutch. & Dalziel.
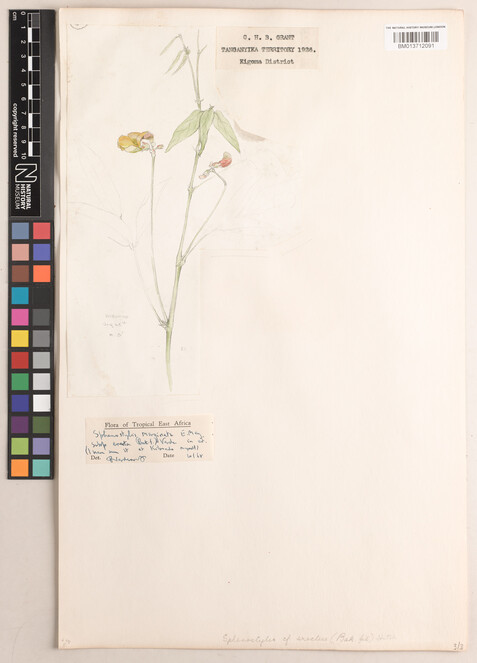
Specimen BM013712091 - Sphenostylis marginata subsp. erecta (Baker f.) Verdc.
For all specimens, the following data were entered:
- Catalogue/Specimen and acquisition/registration numbers: Captured verbatim.
- Collection Date: Captured verbatim.
- Collectors: Transcribed verbatim.
- Location: The locality, district, province, country and continent were all interpreted from the label in addition to copying the verbatim transcription from the label.
- Georeference: Latitude and longitude were entered where identifiable.
4.2.2 Results
Table
Results from Test 1 comparing direct entry into a Collections Management System and Excel.
| Number of records | Time taken to transcribe (minutes) | Minutes per specimen | |
| Collections Management System | 50 | 355.5 | 7.11 |
| Excel | 50 | 343 | 6.86 |
When transcription and georeferencing was split into two stages, the time taken decreased (Table
| Number of records | Time taken (minutes) | Minutes per record | Total (minutes per record) | |
|---|---|---|---|---|
| CMS - stage 1 | 50 | 74 | 1.48 | 5.34 |
| CMS - stage 2 | 193 | 3.86 | ||
| Excel - stage 1 | 50 | 140 | 2.80 | 5.82 |
| Excel - stage 2 | 151 | 3.02 |
Transcription and georeferencing timings by label category can be seen in Table
4.2.3 Discussion
The shortened time for inputting data into Excel may be different for other institutions working with a different CMS in which data entry is more streamlined or for which a user interface is more efficient. In this case, the differences between the CMS and Excel are 15 and 30 seconds, respectively, and when that is related to a 7 and 5 minute process it is unlikely that the difference between systems is significant.
The researcher also noted that the staged approach is only suitable for larger collections in which there is a higher chance of multiple similar specimens grouping together than with small collections.
While the time for the above Bombus and butterflies was roughly 35 seconds per specimen, these specimens required roughly 5-6 minutes per specimen. This dramatically increased length of time is likely due to the time-consuming process of georeferencing.
4.3 Luomus Pinned Insect and Herbarium Digitisation
Luomus has digitised 300,000 specimens from their pinned insect collection and 400,000 specimens from their herbarium sheet collection. The herbarium sheet workflow in this case included only general herbarium, specimens from outside of Fennoscandia, as more than 50% of Fennoscandian herbarium have already been digitised while only 1-2% of general herbarium have been digitised. The insect collection is predominantly from the early 19th century with many handwritten labels but some of the more recent specimens (1850-1950) have their data typed or printed on their labels. Even for recent specimens a significant majority still have some handwritten data on their labels.
A semi-automated conveyor belt system for pinned insects and herbarium digitisation contributes considerably to digitisation throughput (
4.3.1 Information and workflow
For pinned insects, transcription data was entered directly into Excel and then later uploaded into the CMS. Similar to the NHMUK’s Legumes sheet case, transcription is done in two phases - (1) imaging and transcription and (2) additional transcription, cleanup and verification. All data on the labels are interpreted rather than transcribed verbatim and read from the label images on the preview screen of the digitisation line. A minimum amount of data are collected in phase one depending on the clarity and ease of transcription from the label. Taxon and collection always immediately transcribed and, if time allows, country, locality, date and collector are also transcribed. If the specimen requires more time for transcription, the record is flagged for secondary transcription to be returned to later.
In the second phase of post-processing, specimens that were tagged for errors are cleaned up:
-
Collectors: Names are expanded if possible (from ‘Lauro’ to ‘Lauro, Viljo’; from ‘Lindbg.’ to ‘Lindberg’).
-
Collection Date: Impossible dates are updated and then flagged for verification (from ‘31.9.1909’ to ‘30.9.1909’.
-
Locality: Place names are modernised, checked for typos and made congruent with matching place names (from ‘Hellsinki’ to ‘Helsinki).
-
Georeferencing: Specimens are georeferenced to find the latitude/longitude semi-automatically by comparing to a list of approximately 2000 known localities that were curated manually prior to the digitisation process.
Once the data have been captured, an adhesive label with a unique barcode is printed and mounted on the sheet.
For herbarium sheets, data are entered directly into a custom web-based application - LumousWBF - and then uploaded into the CMS. The following data are all entered at the same time:
-
Collection ID, Specimen ID and Owner.
-
Digitisation ID: This is the UID generated automatically by the digitisation system.
-
Taxon: This is copied from what is on the folder.
-
Continent: This is selected from a collection of 11 options, with more specific categories available for local species.
-
Notes and Tick Marks: If needed, there is space to flag messy sheets that need manual checking after imaging.
At the moment, only a minimal amount of data is transcribed in an effort to digitise as much of the collection as possible rather than go in-depth on priority specimens.
4.3.2 Results
For pinned insects, transcription adds 25-30% of time on top of the time for barcoding and imaging. The first phase of transcription, which includes only basic information, processes 300-500 specimens a day. Calculated across an 7.5 hour day, this amounts to 0.9 to 1.5 minutes per specimen. Phase two georeferencing and cross-checking adds additional time on top of this.
The throughput for herbarium sheets is approximately 1000 sheets per day or 2.22 minutes per sheet.
4.3.3 Discussion
Unlike the NHMUK, transcription was done at the time of imaging. The pinned insect collection was georeferenced which likely contributed to the time required for each specimen, although was significantly shorter than NHMUK’s legume sheets. This may be due to the slight automation of the process by connecting to a places database.
The team noted that OCR software had been tried, but because most of the specimens are old and at least partially handwritten, this did not perform well.
4.4 RBGK Leguminosae subtribe Phaseolinae, Dalbergia and Pterocarpus
The collection consisted of 23,700 specimens that needed to be digitised for a specific research project on Leguminosae. The funds were not available to support full label transcription for all specimens and no georeferencing was carried out as a result. In order to work efficiently with the funds available, different workflows and transcription levels were used for different specimens depending on their priority.
This case also relied on different groups of transcribers with different levels of experience with collections and transcription. The two main transcribers were quite familiar with herbarium specimens with multiple years of experience in both herbarium and fungarium transcription and digitisation. The limitation in funds also led to the use of an online volunteer service in order to crowdsource transcriptions from the general public, thus providing an important case into transcription timings and costs associated with this method.
4.4.1 Information and workflow
The workflow was broken out into three stages - folder level transcription and imaging, full transcription and volunteer transcription. First, specimens were barcoded and data were input directly into MS Access. A form was designed specifically for the process to allow one entry for multiple specimens with the same folder level information so that a new record wouldn’t have to be created every time. Folder level information was gathered before the specimens were imaged and then, if further transcription was required, this was done from images later in the process. The following data were transcribed verbatim:
-
Box Name (this was a temporary name used to help track specimens through the digitisation process) entered once per data entry session
-
Barcode UID - Read using a barcode reader
-
Entered by - selected once per data entry session
-
Type status - dropdown
-
Project Name - dropdown Selected once per data entry session
-
Family, Genus, Species: Taxon names were selected from a pre-populated drop down list
-
InfraSpec Rank and InfraSpec Name
-
Identification Qualifier - drop down
-
Higher Geographical Region and Country (no georeferencing) - drop down for region
-
Restrictions - Tick box
Image metadata including the list of barcodes (files), user, imaged date, harddrive number, camera asset number and resolution were then manually entered. Macros were used to generate the list of barcodes from the filename. Lastly the primary data from the records were checked against the image data using automated queries to highlight any missing records or images, which were then backfilled.
In phase two, the specimens were divided into two groups - (1) priority specimens flagged as high priority and fully transcribed and (2) a second tier of priority specimens selected for more transcription, but not at the level of depth of the first group.
For the first group, a list of 73 data fields were considered, although many were left blank as they were not present on the label. However all determinations on the sheet were transcribed. Only 50 specimens were transcribed per person per day to this level of depth. For the second group, the following data were transcribed:
- Collector and collector number
- Collection date
- Country
- Locality
- Altitude
Phase three then extended all remaining transcriptions to a crowdsourcing platform called DigiVol. The majority of the information on the label was captured with the exception of the determination history - volunteers were asked to transcribe only the most recent determination on the specimen. While the funded project was running, every specimen transcribed was validated by project staff.
4.4.2 Results
The first phase in the process of imaging and basic data transcription cost £130 for 200 specimens (the average daily rate of digitisation for one person), or £1.50 per specimen to cover staff costs.
The level of transcription for the second phase was considerably deeper. Only 50 specimens were transcribed per person per day - or 9 minutes per specimen - with each cost transcription costing £2.60 for staff time.
The third phase that covered primarily collector and geographic data had a throughput of 90 specimens per person per day - or 5 minutes per specimen - at a cost of £1.44.
The rate of transcription in the crowdsourcing platform was around 50 specimens per day - similar to a rate of one digitiser. The rate of validation when completed by volunteers is much slower at half the rate of transcription as there are few volunteers validating; however staff validated at a rate of approximately 100 specimens per day. The amount is variable depending on the experience of transcribers who complete the transcription. The direct cost for the volunteers was £0, but the cost for validation from £1.18 per specimen for staff. Other indirect costs for managaging crowdsourcing (e.g. platform maintenence, uploading data, and communication with volunteers) was not included.
4.4.3 Discussion
Kew reported positive results from the work with DigiVol and its use in ongoing digitisation work has continued, with the goal of digitising the remaining specimens in this project.
4.5 Meise Botanic Garden Google Cloud Vision API Trial
In assessment of the dataset published by
Costwise, the Google Vision API is free if the number of submitted images does not exceed 1,000 per month, after which price depends on the functionalities requested. New users receive a €270 voucher which covers all expenses incurred in this type of trial aside from the original imaging costs.
4.5.1 Information and workflow
All 1800 images had been uploaded in a JPEG format as part of a pilot trialing Zenodo. A summary file listing all Zenodo image URLs was also made available on Zenodo. Using a Python script which relied primarily on the Python Google Cloud Vision API Client Library (https://googleapis.dev/python/vision/1.0.0/index.html), the images were supplied to the Google API from the Zenodo URLs. The API was accessed by setting up a service account to generate a JSON bearer token. The script and some further documentation can be found at https://github.com/AgentschapPlantentuinMeise/gcloud-vision.
The requested services were text detection, document text detection, label detection, logo detection and object localization. Text detection is OCR for extracting pieces of text from an image. Document text detection is a method more optimized for dense text, such as scanned documents. It is also capable of recognizing handwritten text. Label detection is the annotating of images with labels describing features present in them. For more information, see https://cloud.google.com/vision/docs/how-to.
In the first run, 188 requests out of 1,800 (10%) failed. These failures are rendered through different error codes in the JSON response, so that the API itself sees them as successes. 16 failures were due to large file sizes of images, 52 were due to failed access to the image URL and the remaining 120 were assigned a vague error of ‘Bad image data.’ This message may have been due to a megapixel limit, as mentioned in a related discussion on Stackoverflow. A second run resolved a majority of the URL errors, but not the ‘Bad image data’ ones.
In a final third run of 133 images, all of the images breaching the file size and presumed megapixel limits were auto-resized through a batch conversion tool (IrfanView 4.50), then uploaded to a Google Cloud Storage bucket, as per Google’s guidelines. In their guidelines, Google advises against using third party URLs for image submission. The Python script was modified to access the URLs from Google Cloud rather than Zenodo which resolved all remaining errors.
4.5.2 Results
Considerable time was needed to image the specimens; For more information, see
Processing time through the API is in the range of ca. 15 minutes for 133 images. Previous runs took less time per image, but that is most likely due to the larger rate of failure.
4.5.3 Discussion
Using an automated service like an API requires a specific in-house skill set different than manual workflows - a computer programmer that can establish connection to the API.
While the cost for this test was very low and easily covered by the voucher, it is difficult to predict the exact costs of a project from the Google console. Failed requests are still billed, even in cases where the API fails to retrieve the image such as in the cases of broken URLs. While these errors can be diminished once Google Storage URLs are assigned and images are resized according to the guidelines, the number of errors and the associated cost of re-running them, are difficult to predict. This also implies additional costs for Google Storage depending on the number of images involved. Quality assurance was not included as part of this trial but would be critical in understanding cost effectiveness compared to other methods.
4.6. Meise Botanic Garden first mass digitisation Project DOE!
In 2015, Meise Botanic Garden started its first mass digitisation project DOE!. Within this project 1.2 million herbarium specimens from the African and Belgian vascular plant collection were digitised. These collections were selected among others because Meise has the reference collections for both Belgium and central Africa. The original plan was to digitize only the central African specimens, which are easily recognisable as they are stored in a brown folder, while the rest of the African specimens are kept in a green folder. However, it turned out to be very inefficient to only take the central African specimens out of storage, as they are still mixed together with the other African ones in the same cupboards. So it was decided to scan all specimens in these cupboards and thus digitize the whole African collection.
4.6.1 Information and workflow
In order to work efficiently with the funds available, three different workflows were used during the DOE! Project. Two different workflows - one manual in-house process and a second outsourced manual process - were used for the African collection. Staff resources for processing all specimens in-house were insufficient. For the Belgian collection, a volunteer service was used, in part as outreach to the Belgian public.
The African Collection
The African collection holds approximately 1 million specimens of which 60% were collected in central Africa (Congo DR, Rwanda and Burundi). The specimens are stored in alphabetical order by family, genus, species, country, phytoregion and collector, and the collection is well curated.
For 407,329 specimens, only minimal data - filing name, barcode, collector, number and country (and phytoregion for central African specimens) - were entered directly into the CMS, BGBase, by herbarium technicians and volunteers. On average, 10 to 15 people encoded minimal data for 2 hours each work day for a period of 20 months. All data were entered verbatim except for the filing name. For collector, both verbatim and interpreted data were input because the link was made between the verbatim data and our collectors table in BGBase.
Additional data for 117,338 of the above records were added by Alembo, a company that specialises in transcription services and has been contracted to transcribe herbarium specimen labels for Naturalis in the Netherlands and the Smithsonian Institute in the USA. Transcription is done from digital images and entered directly into Alembo’s proprietary transcription tool. In addition to basic details, date (day, month, year and date as given), altitude (height, range and unit) and coordinates are also entered (if available on the label). For another 415,364 specimens, all the minimal and additional data as described above were entered by Alembo in addition to country_as_given for collectors. Meise provided a lookup table where we linked to the collector’s codes of BGBase.
It took Alembo approximately 7 months to transcribe the data. In conjunction with Alembo’s transcription, 6 people from Meise were checking 10% of the transcribed specimens, giving feedback where necessary.
After Alembo’s transcription data were approved, a .csv file was created from the data. Before the data was imported into Meise’s CMS, the database manager assessed the quality of the data transcribed by Alembo to be good. In addition, thanks to the huge amount of data, he was able to further improve the quality of the data before the import by sorting on collector and collection number. Interpretation errors that could not have been determined without the availability of all other label data could be filtered out this way. For example, erroneous transcriptions for country could be addressed by sorting on collector and with ascending collector number. However, data quality improvement in this way is very time consuming and took a couple of months time to finish.
The Belgian Collection
For the Belgian collection a different approach was chosen because Meise wanted to get the public involved in the activities of the Garden and its collection. DoeDat was created, a multilingual crowdsourcing platform based on the code of the Atlas of Living Australia (https://www.doedat.be). Alembo was used for preliminary transcription of the filing name but then further transcription was conducted in DoeDat.
During the preparatory phase of the digitisation, a cover barcode was added to a folder every time a filing name changed. These covers with the cover barcode were also imaged on the conveyor belt and were linked to all the subsequent specimens. Only these cover images were sent to Alembo who transcribed only the filing name from the cover using a lookup list which was provided by the garden. After approval, the filing name and barcode were the only information that was added to the CMS.
Different projects were then created within DoeDat based on families and put up one by one. Volunteers in DoeDat were asked to transcribe the following label data from the 307,547 Belgian herbarium sheets: Scientific name as given, vernacular name, uses, collectors as given, collector (standard through a lookup table), collector number, collection date (day, month, year, range and date as given), habitat, cultivated?, plant description, misc, locality as given, altitude, IFBL grid cell (http://projects.biodiversity.be/ifbl/pages/methodology), coordinates as given and country.
Transcriptions were then validated for ca. 15,000 sheets. Of these, only 4 were ruled as invalid. Validation took between 1.7 - 1.9 minutes per specimen. Minor corrections, such as typos, are not counted as invalid.
4.6.2 Results
Considerable time was needed for all approaches. When staff entered minimal data, up to 70 specimens per hour per person could be transcribed directly in the collection management system.
Outsourcing label transcription is per item at the point of transcription, but requires staff to conduct quality control. Sufficient time is also needed for preparation of the protocol, training the transcribers and import of the data into the CMS.
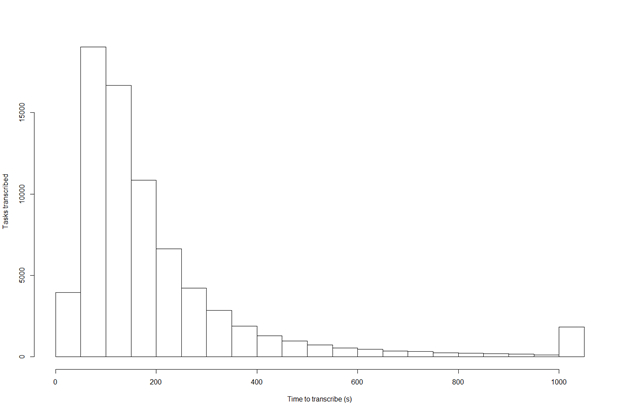
For crowdsourcing, data entry is much slower, and additional resource is required to maintain the portal and ongoing projects, as well as significant effort put into advertising the platform. However, it is a beneficial method if the objective is to connect with citizens who are interested in science. As of 20 November 2019, volunteers had transcribed almost 75,000 herbarium specimens since the launch early 2018 and it took an average 3.5 - 4.1 minutes to digitise a specimen between transcription and validation. The platform now has more than 300 active volunteers, but the majority of contributions to these herbarium sheet projects come from a dedicated core group of users. Most transcription sessions seem to take less than 200 seconds (Fig.
4.6.3. Discussion
Meise is pleased with the quality of the data that came from Alembo. However, the following needs to be taken into account: during the preparatory phase, it can take a number of months to come up with a good transcription protocol. The protocol must apply for all the variations in label information. Significant time for training Alembo staff must also be considered, as well as maintaining sufficient internal staff to quality assurance during the transcription process either during or after the process.
Meise Botanic Garden will continue with DoeDat and try to expand the portal to other institutes to get more people to the platform.
5. Discussion
5.1 Aggregate Results
A lack of a full financial breakdown and full data quality information for many of these workflows limits our ability to understand the costs and cost-effectiveness for each transcription package. Slight differences in the way data were transcribed, the amount of data transcribed and its formatting led to differences in the pace of transcription. Differences in how institutions measure and report their data also make it difficult to make direct comparisons. Some focused on testing different input methods while others use a single process. Some institutions measured time starting at imaging through to georeferencing while others only looked at the time to transcribe.
However, even with these differences, the approximate minutes per specimen per person were available for each of the different methods for each institution, providing helpful information on the time ranges associated with different methods (Table
| Project | Collection Type | Method | Included Georeference? | Verbatim or Interpreted? | Resolved to Pre-Filled List? | Time per specimen per person |
| NHMUK 1a: Bombus | Pinned insects | In-house staff manual |
YES (UK only) |
Mixed | For locality and georeference | 33 seconds |
| NHMUK 1b: Birdwing butterflies | Pinned insects | In-house staff manual | NO | Mixed | For locality | 38 seconds |
| NHMUK 2: Leguminosae | Herbarium sheets | In-house staff manual | YES | Majority verbatim | None | 5 - 6 minutes |
| Luomus 1a | Pinned insects | In-house staff manual | YES | Interpreted | For georeference | 0.9 - 1.5 minutes |
| Luomus 1b | Herbarium sheets | In-house staff manual | NO | Interpreted | For continent | 2.22 minutes (p/ sheet) |
| RBGK: Leguminosae | Herbarium sheets | In-house staff manual & Crowdsourcing | NO | Mixed |
taxonomic Names Country |
9 - 14 minutes |
| Meise 1: Various | Herbarium sheets | Google Vision API | NO | Verbatim | None | 6.6 seconds |
| Meise 2a: Africa Collection | Herbarium sheets | In-house staff manual | Coordinates entered if on label | Both | For collectors | 51 seconds |
| Meise 2a: Africa Collection | Herbarium sheets | Outsourced manual | Coordinates entered if on label | Verbatim | For collectors | n/a |
| Meise 2b: Belgium Collection | Herbarium sheets | Crowdsourcing | Coordinates entered if on label | Verbatim | None | 3.5 - 4.1 minute |
One tranche of cases reported times of less than 1 minute to transcribe a specimen. The fastest reported was for the Google Vision API test which transcribed 133 images in 15 minutes. However, this does not account for the time writing scripts for the API, troubleshooting failed transcriptions and quality checking the final result. NHMUK cases 1a and 1b followed a fairly standard manual workflow but did not include comprehensive manual georeferencing for the entire collection as was the case in the second NHMUK case. Similarly, the manual input of the Africa Collection for Meise 1a, with a transcription time of 51 seconds, did not include georeferencing.
A second tranche of cases from Luomus reported times between 0.9 - 2.22 minutes. This process did include a degree of georeferencing for a subsample of the collection but was made more efficient by drawing from a list of approximately pre-named localities that were curated manually prior to the digitisation process.
A third tranche of cases reported times between 5 and 15 minutes and one significant outlier of 41 minutes for crowdsourcing. The second NHMUK case which took 5-6 minutes included detailed and time-consuming georeferencing. The case from RBGK utilised both in-house staff and crowdsourcing but with similar timing per specimen for both (when the time to quality check volunteers’ outputs was not incorporated). Note that for crowdsourcing each individual might be taking longer than RBGK staff would on transcribing a single record but the community as a whole was producing ~50 transcriptions per day. The range from 9-14 minutes is based on the amount of detail transcribed as some specimens had less data added than others.
5.2 Variables that have an impact on transcription times
A number of variables can have an impact on the time taken for transcription and, therefore, the cost.
5.2.1 Data depth and georeferencing
Simply put, the more data that is transcribed, the longer the transcription process. While specific times for specific sub-steps are difficult to collect, georeferencing is notable for the significant increase in time it adds to transcription. It is the most time consuming piece of digitisation and a majority of these cases did not include it in their workflow or for all specimens in the collection.
It could be argued that georeferencing should not be included as part of the transcription process as it involves more than the simple translation of label text to digital text. However, as was the case for the NHMUK Birdwing Butterfly collection, some projects require georeferencing to be included in digitising a collection because the data is necessary for specific research. In this case, institutions should account for the significant increases in time and cost this will add in order to create more valuable higher quality data (
5.2.2 Workflow efficiency
Many cases followed a two-phased approach to transcription, first documenting basic information like UID, name and collection and then returning to important specimens later to add in more detailed information like dates, georeferences, altitude, etc. In some cases, small efficiency gains were accomplished through either 1) categorising collections either by region or collector, 2) selecting inputs from a pre-set list of options or 3) designing CMS workflows for maximum efficiency.
In the NHMUK example, selecting or sorting specimens for transcription by a common variable saved time by decreasing the number of unique inputs that had to be identified for each specimen. Both the NHMUK and LUOMUS provided examples of selecting collectors or geographies from a predetermined list which helps with both transcription times and data consistency.
Important consideration should also be given to designing the workflow within the CMS or input system to minimise the amount of new windows, folders or objects that need to be created to add a new specimen. RBGK designed a form specifically for their workflow to allow one entry for multiple specimens with the same folder level information so that a new file wouldn’t have to be created every time. These types of efficiency gains, while small, can lead to considerable savings when multiple across thousands of specimens.
5.2.3 Automation
While small efficiency gains in workflow can help, transcription times and costs will always be considerable when requiring manual input. Automation tools like Google Cloud Vision offer great potential to transcribe en masse. As the Meise case study shows, tests of these tools are still in their preliminary phases. While the cost savings for the actual transcription phase could be significant, consideration will also need to be given to 1) the time necessary to create a clean dataset that can easily run through an automation system; 2) development time necessary to work with the APIs; and 3) the required post-processing time for QA. Automation may be necessary for these phases as much as the transcription itself in order to see meaningful cost and time savings.
Despite this potential, OCR tools like this may be out of reach for many digitisation projects either due to lack of development resources or at-scale funding in order to integrate it into workflows, modify institutional collections management systems and buy required computing infrastructure. However, there are alternative forms of automation that could be considered such as building macros to assign image metadata or pulling geography automatically into a form (
5.2.4 Crowdsourcing
While these automated tools are still being tested, crowdsourcing offers a means for transcription at lower direct cost but as the Meise case shows, the costs saved in transcription may ultimately be offset (or exceeded) on quality checks for the transcribed data. This may be overcome by attempts to work closely with a subset of more experienced citizen scientists but this would, in turn, require more project management from staff. Considerable time will also need to be spent on setting up and managing the projects in the crowdsourcing platform as well as recruiting and sustaining volunteers. The RBGK and Meise cases show that these trade-offs in time and quality mean that pursuing a crowdsourced solution is more a matter of intentionally pursuing the engagement of volunteers and citizen scientists rather than seeking a more cost-effective means of transcription.
5.2.5 Training & Expertise
The experience level of the transcribers is a factor not only in data accuracy but in speed as well - either because an experienced transcriber is able to more quickly identify obscure items like collector and place names or because an experienced transcriber is needed to check the work of volunteers. Some of this could potentially be overcome by pre-filled fields, and/or contextual recommendations based on data in other fields. In addition to general transcription experience some projects require, or significantly benefit from, other expertise such as the knowledge of other languages, old forms of handwriting (like the old German Kurrent) and slang.
6. Conclusion
Achieving fast, efficient and cost-effective means of transcribing label data is one of the major barriers to mass-digitising natural history collections.
Automated solutions like OCR with Google Vision and other tools should be further explored and tested where resources allow. Getting these tools to a point where they can be relied upon to transcribe label data accurately and cost-effectively may require significant time and upfront costs to create training data sets and conduct quality checks. Further research will also need to be conducted on the cost of tools like this when working with datasets in the millions rather than smaller tests. Little is known at this point about the differences in cost between employing in-house staff compared to an OCR service. These questions and tests are being further explored through adjacent SYNTHESYS+ work packages. However they are likely to provide the best long-term solution.
In the meantime, if the objective is to transcribe as many labels as possible quickly but with limited staff resources or time, outsourcing to a service like Alembo can be an effective approach. However, as the process is still manual and significant training and project management resources are still required, it may not result in significant time or cost savings. As such, this may only be a solution for institutions who lack the in-house staff for constant transcription.
A crowdsourcing platform can also be an effective means of transcription as the project management and quality assurance resources are available within the institution. However, this is primarily for institutions who have the specific aim to increase citizen engagement.
A community database or resource with examples of handwriting, especially of prolific but hard to read collectors, could aid future transcription. It could also help with automated handwritten text recognition.
Many institutions will likely continue to transcribe labels in-house and manually while automated solutions are tested. Forecasts on time and associated costs should take into consideration the depth of data that will be transcribed, whether this will include georeferencing, and the time required for quality assurance. Methods for improving the efficiency of the workflow, either through pre-populated pick-lists, specimen batch groups by collector or location and improvements on entry mechanisms in a CMS should all be explored.
The means of aggregating data for this report - through case studies with very little cost data reported - is indicative of the difficulty in measuring and understanding the true cost of transcriptions and relies instead on time estimates of variable quality. Institutions are encouraged to run in-house tests and measure the time and cost spent on transcribing data in order to gain better insights into the true cost of the process. This will aid in building the business case for switching to an outsourced or automated solution should the need or opportunity arise.
Grant title
ICEDIG – “Innovation and consolidation for large scale digitisation of natural heritage”, Grant Agreement No. 777483
Author contributions
Authors:
Stephanie Walton: Data Curation, Investigation, Visualisation, Writing - Original Draft. Laurence Livermore: Conceptualisation, Methodology, Supervision, Writing - Original Draft, Writing - Review and Editing. Sofie De Smedt: Resources, Writing - Original Draft. Mathias Dillen: Resources, Writing - Original Draft. Quentin Groom: Resources, Writing - Original Draft. Anne Koivunen: Resources, Writing - Original Draft. Sarah Phillips: Resources, Writing - Original Draft.
Contributors:
Elizabeth Louise L Allan: Resources. Silvia Montesino Bartolome: Resources. Richard Boyne Resources. Helen Hardy: Writing - Review and Editing. Laura Green: Resources. Phaedra Kokkini: Resources. Krisztina Loyonya: Resources. Marie-Hélène Weech: Resources. Peter Wing: Resources.
Contribution types are drawn from CRediT - Contributor Roles Taxonomy.
References
-
Digitisation infrastructure design for Zenodo.Zenodohttps://doi.org/10.5281/zenodo.3346782
-
Data Quality of Crowdsourced Label Transcription: Miniature Lives Magnified.Zenodohttps://doi.org/10.5281/zenodo.3709793
-
A Novel Automated Mass Digitisation Workflow for Natural History Microscope Slides.Biodiversity Data Journal7https://doi.org/10.3897/bdj.7.e32342
-
A benchmark dataset of herbarium specimen images with label data.Biodiversity Data Journal7https://doi.org/10.3897/bdj.7.e31817
-
Mapping Life – Quality Assessment of Novice vs. ExpertGeoreferencers.Citizen Science: Theory and Practice1(1). https://doi.org/10.5334/cstp.30
-
Updating data standards in transcription.Zenodohttps://doi.org/10.5281/zenodo.3386211
-
Improved standardization of transcribed digital specimen data.Database2019https://doi.org/10.1093/database/baz129
-
Best practice guidelines for imaging of herbarium specimens.Zenodohttps://doi.org/10.5281/zenodo.3524263
-
Costbook of the digitisation infrastructure of DiSSCo.Research Ideas and Outcomes (In Prep.).
-
Minimum Information about a Digital Specimen (MIDS) v0.8.Unpublished.
-
Transkribus - A Service Platform for Transcription, Recognition and Retrieval of Historical Documents.2017 14th IAPR International Conference on Document Analysis and Recognition (ICDAR)https://doi.org/10.1109/icdar.2017.307
-
Specification of data exchange format for transcription platforms.Zenodohttps://doi.org/10.5281/zenodo.2598413
-
Georeferencing the Natural History Museum's Chinese type collection: of plateaus, pagodas and plants.Biodiversity Data Journal8https://doi.org/10.3897/bdj.8.e50503
-
The history and impact of digitization and digital data mobilization on biodiversity research.Philosophical Transactions of the Royal Society B: Biological Sciences374(1763). https://doi.org/10.1098/rstb.2017.0391
-
Towards a scientific workflow featuring Natural Language Processing for the digitisation of natural history collections.Research Ideas and Outcomes6https://doi.org/10.3897/rio.6.e55789
-
Report on New Methods for Data Quality Assurance, Verification and Enrichment.Zenodohttps://doi.org/10.5281/zenodo.3364509
-
Natural history collections and digital skills of citizens.Zenodohttps://doi.org/10.5281/zenodo.3364541
-
On natural history collections, digitized and not: a response to Ferro and Flick.ZooKeys618:145‑158. https://doi.org/10.3897/zookeys.618.9986
-
Bringing collections out of the dark.ZooKeys209:1‑6. https://doi.org/10.3897/zookeys.209.3699
-
Darwin Core: An Evolving Community-Developed Biodiversity Data Standard.PLoS ONE7(1). https://doi.org/10.1371/journal.pone.0029715