|
Research Ideas and Outcomes : Research Article
|
|
Corresponding author: Elizabeth E. Graham (elizabeth.e.graham@usda.gov)
Received: 16 Nov 2019 | Published: 25 Nov 2019
This is an open access article distributed under the terms of the CC0 Public Domain Dedication.
Citation: Bowser ML, Burr SJ, Davis I, Dubois GD, Graham EE, Moan JE, Swenson SW (2019) A test of metabarcoding for Early Detection and Rapid Response monitoring for non-native forest pest beetles (Coleoptera). Research Ideas and Outcomes 5: e48536. https://doi.org/10.3897/rio.5.e48536
|
|
Abstract
In response to the threat of introductions of non-native forest insects, the Early Detection and Rapid Response (EDRR) program in Alaska monitors for arrivals of non-native insects, an effort that is limited by the time required to process samples using morphological methods. We compared conventional methods of processing EDRR traps with metabarcoding methods for processing the same samples.
We deployed Lindgren funnel traps at three points of entry in Alaska using standard EDRR methods and trap samples were later processed using routine sorting and identification based on morphology. Samples were then processed using High Throughput Sequencing (HTS) metabarcoding methods. In three samples bycatch was included and in three samples non-native species were added.
Morophological and HTS methods yielded generally similar results for scolytine and cerambycid beetle assemblages, but HTS provided more species-resolution identifications (46 species) than morphological methods (4 species plus the 3 non-native species known a priori). None of the non-native species were detected by HTS. Including bycatch did not appear to hinder identifications of scolytine and cerambycid beetles by HTS. From among the bycatch, two Palearctic species adventive to North America, Placusa incompleta Sjöberg, 1934 and Hydrophoria lancifer (Harris, 1780), are newly reported from Alaska.
We do not recommend replacing our current morphological monitoring methods with HTS methods because we believe that we would be more likely to detect known non-native pest species using morphology. However, we would use HTS to increase our sample size without greatly increasing time required to process samples. We would also recommend HTS methods for surveillance monitoring where the set of target taxa is not limited to known pest species.
Keywords
Scolytinae, Cerambycidae, biomonitoring, High-Throughput Sequencin
Introduction
The introduction and establishment of non-native forest insects is considered to be one of the greatest threats to forest health (
A methodological bottleneck constraining the EDRR program in Alaska is the time and expertise required to process EDRR trap catches, limiting the number of traps that can be deployed each season. A potential solution to this taxonomic bottleneck is the use of recently developed metabarcoding methods. Biomonitoring by metabarcoding has been advocated for arthropods because these methods have the potential to be much faster and less costly than identifications obtained by morphology (
We sought to compare EDRR trapping results obtained by conventional means and by metabarcoding to determine if metabarcoding methods would be more appropriate for EDRR monitoring than methods currently used.
Methods
Field sampling
Lindgren funnel traps were deployed at three sites in Alaska: Joint Base Elmendorf-Richardson, Anchorage Borough (61.2547 °N, 149.7698 °W); Eielson Air Force Base, Fairbanks North Star Borough (64.6576 °N, 147.0535 °W); and the Juneau Ferry Terminal, Juneau Borough (58.3779 °N, 134.6983 °W) (Fig.
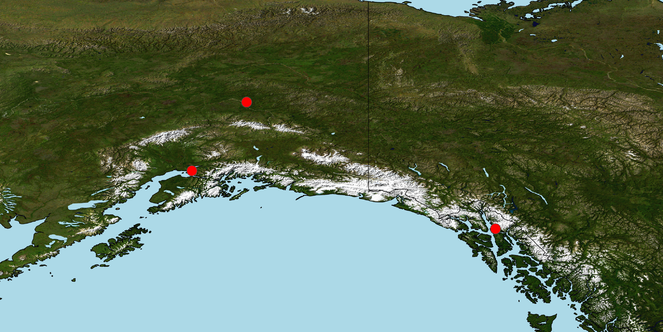
Field methods followed standard EDRR methods as described by
Laboratory methods
Twenty-six samples were processed using standard EDRR methods where all bark and wood-boring beetles were separated from bycatch by hand and identified by morphology. Forest health specialists trained in insect taxonomy identified specimens to the finest level of taxonomic resolution that their training allowed. In a typical EDRR work flow, some specimens would have been selected to be sent out to specialists for expert identification, but in this project all bark and wood-boring beetles were retained for DNA sequencing. Separating bycatch required roughly 64 work hours (2.1 hours/sample) and the identification step took another 64 work hours.
Four additional samples were used to test detection of exotic species and to determine if skipping the time-consuming step of removing bycatch reduced our ability to identify bark and wood-boring beetles. Dried specimens of Ips typographus (Linnaeus, 1758) were added to sample JBER10MAY17-R2, dried specimens of Tetropium fuscum (Fabricius, 1787) were added to sample JNUF20JUN17-R, and a live Halyomorpha halys Stål, 1855 was added to sample JBER10MAY17-R1. Bycatch was included in three samples (JBER10MAY17-R1, JBER10MAY17-R2, and JBER20JUN17-R). See Suppl. material
Thirty samples were delivered to RTL Genomics (http://rtlgenomics.com) on October 23, 2017. The E.Z.N.A. Insect DNA Kit (Omega Bio-tek, Inc., Norcross, Georgia, USA) were used for extractions. Insects were ground in liquid nitrogen using a pre-chilled mortar. Using a small spatula, a pea size amount of the insect homogenate was loaded into a sample tube. The remaining ground homogenate was saved and stored in the freezer. To each tube, 350 μl of CTL buffer and 25 μl of Proteinase K was added and the sample pipette mixed to gently mix the sample and buffers. The sample was incubated at 60 °C for 30 minutes with gentle shaking. After the incubation, 350 μl Chloroform: isoamyl alcohol (24:1) was added and gently vortexed. Samples were centrifuged for 2 minutes at 10,000 g, then 300 μl of supernatant was transferred to a new tube. Equal volumes of BL buffer and 2 μl RNase A were added and mixed by pipette. This was incubated at 70 °C for 10 minutes. Equal volumes of 100% ethanol was added and mixed by pipette, then 750 μl of lysate were transferred to HiBind DNA Mini Columns and centrifuged at maximum speed for 1 minute. Flow through was discarded. This was repeated until all lysate has been loaded onto the column. The column was transferred to a new collection tube, 500 μl of HBC buffer was added, and this and centrifuged at maximum speed for 30 seconds. Flow through was discarded, 700 μl of DNA Wash buffer was added, and the column was centrifuged at maximum speed for 1 minute. Flow through was discarded and the wash was repeated. The column was dried by centrifuging at maximum speed for 2 minutes, then 50 μl of pre-warmed Elution Buffer was added to the center of the column membrane and incubated at room temperature for 2 minutes. This was centrifuged at maximum speed for 1 minute. Eluate was recovered from the tube and added back to the center of the column, then the column was incubated for 2 minutes at room temperature. This was centrifuged at maximum speed for 1 minute.
Sequencing was performed on an Illumina MiSeq platform and reads were processed using RTL Genomics’ standard methods (Suppl. material
Metagenomics pipeline
Most of the metagenomic portion of the analysis was carried out on the Yeti supercomputer (
A regional reference library of Cytochrome Oxidase I DNA barcode sequences (
Search strings and numbers of records downloaded from BOLD for library construction.
| Search String | Records |
| "Arthropoda"[tax] "Alaska"[geo] | 10,227 |
| "Arthropoda"[tax] "British Columbia"[geo] | 306,010 |
| "Arthropoda"[tax] "Russia"[geo] | 22,032 |
| "Arthropoda"[tax] "Yukon Territory"[geo] | 77,510 |
The library was first dereplicated using VSEARCH (
The FASTQ files delivered by RTL Genomics were imported into QIIME 2 using qiime tools import with options "--type 'SampleData[PairedEndSequencesWithQuality]' --input-format PairedEndFastqManifestPhred33". The paired-end sequences were denoised and dereplicated using qiime dada2 denoise-paired (
The resulting amplicon sequence variant (ASV) table was filtered using the LULU algorithm (
Excluding library construction, which took roughly 16 work hours, HTS methods required about 40 work hours or 1.3 hours per sample.
Data resources
We sought to publish all of our data following the guidlines of
Results
Assemblages of bark and wood-boring beetles detected by both methods were largely congruent, composed mostly of Curculionidae and Cerambycidae. High Throughput Sequencing consistently yielded a higher diversity of taxa and provided identifications mostly at the species or BIN resolution; in contrast, morphological methods yielded lower diversity, with identifications mostly at the resolution of genera.
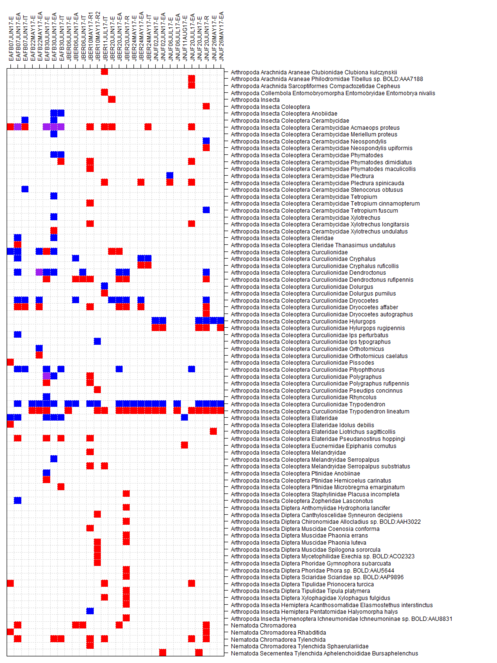
A total of 85 unique identifications were obtained from both methods combined (Table
Identifications obtained by morphological and HTS methods.
| Phylum | Class | Order | Family | Genus and Species | Morphology | HTS |
| Arthropoda | Arachnida | Araneae | Clubionidae | Clubiona kulczynskii Lessert, 1905 | ✓ | |
| Arthropoda | Arachnida | Araneae | Philodromidae | Tibellus sp. BOLD:AAA7188 | ✓ | |
| Arthropoda | Arachnida | Sarcoptiformes | Compactozetidae | Cepheus sp. | ✓ | |
| Arthropoda | Collembola | Entomobryomorpha | Entomobryidae | Entomobrya nivalis (Linnaeus, 1758) | ✓ | |
| Arthropoda | Insecta | ✓ | ||||
| Arthropoda | Insecta | Coleoptera | ✓ | |||
| Arthropoda | Insecta | Coleoptera | Anobiidae | ✓ | ||
| Arthropoda | Insecta | Coleoptera | Cerambycidae | ✓ | ||
| Arthropoda | Insecta | Coleoptera | Cerambycidae | Acmaeops proteus (Kirby 1837) | ✓ | ✓ |
| Arthropoda | Insecta | Coleoptera | Cerambycidae | Meriellum proteus (Kirby, 1837) | ✓ | |
| Arthropoda | Insecta | Coleoptera | Cerambycidae | Neospondylis sp. | ✓ | |
| Arthropoda | Insecta | Coleoptera | Cerambycidae | Neospondylis upiformis (Mannerheim, 1843) | ✓ | |
| Arthropoda | Insecta | Coleoptera | Cerambycidae | Phymatodes sp. | ✓ | |
| Arthropoda | Insecta | Coleoptera | Cerambycidae | Phymatodes dimidiatus (Kirby, 1837) | ✓ | |
| Arthropoda | Insecta | Coleoptera | Cerambycidae | Phymatodes maculicollis LeConte, 1878 | ✓ | |
| Arthropoda | Insecta | Coleoptera | Cerambycidae | Plectrura sp. | ✓ | |
| Arthropoda | Insecta | Coleoptera | Cerambycidae | Plectrura spinicauda Mannerheim, 1852 | ✓ | |
| Arthropoda | Insecta | Coleoptera | Cerambycidae | Stenocorus obtusus Mannerheim, 1852 | ✓ | |
| Arthropoda | Insecta | Coleoptera | Cerambycidae | Tetropium sp. | ✓ | |
| Arthropoda | Insecta | Coleoptera | Cerambycidae | Tetropium cinnamopterum | ✓ | |
| Arthropoda | Insecta | Coleoptera | Cerambycidae | Tetropium fuscum (Fabricius, 1787) | ✓ | |
| Arthropoda | Insecta | Coleoptera | Cerambycidae | Xylotrechus sp. | ✓ | |
| Arthropoda | Insecta | Coleoptera | Cerambycidae | Xylotrechus longitarsis Casey, 1912 | ✓ | |
| Arthropoda | Insecta | Coleoptera | Cerambycidae | Xylotrechus undulatus (Say, 1824) | ✓ | |
| Arthropoda | Insecta | Coleoptera | Cleridae | ✓ | ||
| Arthropoda | Insecta | Coleoptera | Cleridae | Thanasimus undatulus (Say, 1835) | ✓ | |
| Arthropoda | Insecta | Coleoptera | Curculionidae | ✓ | ✓ | |
| Arthropoda | Insecta | Coleoptera | Curculionidae | Cryphalus sp. | ✓ | |
| Arthropoda | Insecta | Coleoptera | Curculionidae | Cryphalus ruficollis Hopkins, 1915 | ✓ | |
| Arthropoda | Insecta | Coleoptera | Curculionidae | Dendroctonus sp. | ✓ | ✓ |
| Arthropoda | Insecta | Coleoptera | Curculionidae | Dendroctonus rufipennis Kirby, 1837 | ✓ | |
| Arthropoda | Insecta | Coleoptera | Curculionidae | Dolurgus sp. | ✓ | |
| Arthropoda | Insecta | Coleoptera | Curculionidae | Dolurgus pumilus (Mannerheim, 1843) | ✓ | |
| Arthropoda | Insecta | Coleoptera | Curculionidae | Dryocoetes sp. | ✓ | |
| Arthropoda | Insecta | Coleoptera | Curculionidae | Dryocoetes affaber Leconte, 1876 | ✓ | |
| Arthropoda | Insecta | Coleoptera | Curculionidae | Dryocoetes autographus (Ratzeburg, 1837) | ✓ | |
| Arthropoda | Insecta | Coleoptera | Curculionidae | Hylurgops sp. | ✓ | |
| Arthropoda | Insecta | Coleoptera | Curculionidae | Hylurgops rugipennis (Mannerheim, 1843) | ✓ | |
| Arthropoda | Insecta | Coleoptera | Curculionidae | Ips perturbatus (Eichhoff, 1869) | ✓ | |
| Arthropoda | Insecta | Coleoptera | Curculionidae | Ips typographus (Linnaeus, 1758) | ✓ | |
| Arthropoda | Insecta | Coleoptera | Curculionidae | Orthotomicus sp. | ✓ | |
| Arthropoda | Insecta | Coleoptera | Curculionidae | Orthotomicus caelatus (Eichhoff, 1868) | ✓ | |
| Arthropoda | Insecta | Coleoptera | Curculionidae | Pissodes sp. | ✓ | |
| Arthropoda | Insecta | Coleoptera | Curculionidae | Pityophthorus sp. | ✓ | |
| Arthropoda | Insecta | Coleoptera | Curculionidae | Polygraphus sp. | ✓ | ✓ |
| Arthropoda | Insecta | Coleoptera | Curculionidae | Polygraphus rufipennis (Kirby, 1837) | ✓ | |
| Arthropoda | Insecta | Coleoptera | Curculionidae | Pseudips concinnus (Mannerheim, 1852) | ✓ | |
| Arthropoda | Insecta | Coleoptera | Curculionidae | Rhyncolus sp. | ✓ | |
| Arthropoda | Insecta | Coleoptera | Curculionidae | Trypodendron sp. | ✓ | |
| Arthropoda | Insecta | Coleoptera | Curculionidae | Trypodendron lineatum (Olivier, 1795) | ✓ | |
| Arthropoda | Insecta | Coleoptera | Elateridae | ✓ | ||
| Arthropoda | Insecta | Coleoptera | Elateridae | Idolus debilis (LeConte, 1884) | ✓ | |
| Arthropoda | Insecta | Coleoptera | Elateridae | Liotrichus sagitticollis (Eschscholtz, 1829) | ✓ | |
| Arthropoda | Insecta | Coleoptera | Elateridae | Pseudanostirus hoppingi (Van Dyke, 1932) | ✓ | |
| Arthropoda | Insecta | Coleoptera | Eucnemidae | Epiphanis cornutus Eschscholtz, 1829 | ✓ | |
| Arthropoda | Insecta | Coleoptera | Melandryidae | ✓ | ||
| Arthropoda | Insecta | Coleoptera | Melandryidae | Serropalpus sp. | ✓ | |
| Arthropoda | Insecta | Coleoptera | Melandryidae | Serropalpus substriatus Haldeman, 1848 | ✓ | |
| Arthropoda | Insecta | Coleoptera | Ptinidae | ✓ | ||
| Arthropoda | Insecta | Coleoptera | Ptinidae | Hemicoelus carinatus (Say, 1823) | ✓ | |
| Arthropoda | Insecta | Coleoptera | Ptinidae | Microbregma emarginatum (Duftschmid, 1825) | ✓ | |
| Arthropoda | Insecta | Coleoptera | Staphylinidae | Placusa incompleta Sjöberg, 1934 | ✓ | |
| Arthropoda | Insecta | Coleoptera | Zopheridae | Lasconotus sp. | ✓ | |
| Arthropoda | Insecta | Diptera | Anthomyiidae | Hydrophoria lancifer (Harris, 1780) | ✓ | |
| Arthropoda | Insecta | Diptera | Canthyloscelidae | Synneuron decipiens Hutson, 1977 | ✓ | |
| Arthropoda | Insecta | Diptera | Chironomidae | Allocladius sp. BOLD:AAH3022 | ✓ | |
| Arthropoda | Insecta | Diptera | Muscidae | Coenosia conforma Huckett, 1934 | ✓ | |
| Arthropoda | Insecta | Diptera | Muscidae | Phaonia errans (Meigen, 1826) | ✓ | |
| Arthropoda | Insecta | Diptera | Muscidae | Phaonia luteva (Walker, 1849) | ✓ | |
| Arthropoda | Insecta | Diptera | Muscidae | Spilogona sororcula (Zetterstedt, 1845) | ✓ | |
| Arthropoda | Insecta | Diptera | Mycetophilidae | Exechia sp. BOLD:ACO2323 | ✓ | |
| Arthropoda | Insecta | Diptera | Phoridae | Gymnophora subarcuata Schmitz, 1952 | ✓ | |
| Arthropoda | Insecta | Diptera | Phoridae | Phora sp. BOLD:AAU5644 | ✓ | |
| Arthropoda | Insecta | Diptera | Sciaridae | Sciaridae sp. BOLD:AAP9896 | ✓ | |
| Arthropoda | Insecta | Diptera | Tipulidae | Prionocera turcica (Fabricius, 1787) | ✓ | |
| Arthropoda | Insecta | Diptera | Tipulidae | Tipula platymera Walker, 1856 | ✓ | |
| Arthropoda | Insecta | Diptera | Xylophagidae | Xylophagus fulgidus Webb, 1979 | ✓ | |
| Arthropoda | Insecta | Hemiptera | Acanthosomatidae | Elasmostethus interstinctus (Linnaeus, 1758) | ✓ | |
| Arthropoda | Insecta | Hemiptera | Pentatomidae | Halyomorpha halys Stål, 1855 | ✓ | |
| Arthropoda | Insecta | Hymenoptera | Ichneumonidae | Ichneumoninae sp. BOLD:AAU8831 | ✓ | |
| Nematoda | Chromadorea | ✓ | ||||
| Nematoda | Chromadorea | Rhabditida | ✓ | |||
| Nematoda | Chromadorea | Tylenchida | ✓ | |||
| Nematoda | Chromadorea | Tylenchida | Sphaerulariidae | ✓ | ||
| Nematoda | Secernentea | Tylenchida | Aphelenchoididae | Bursaphelenchus sp. | ✓ | |
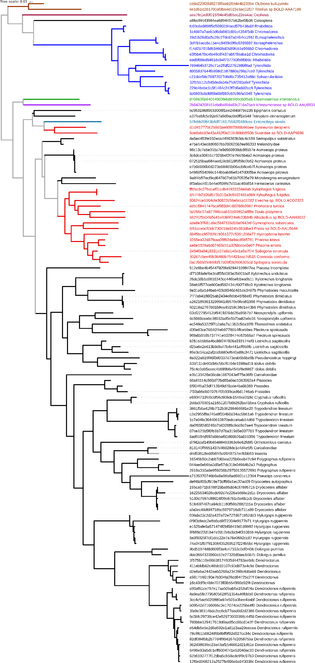
Phylogenetic tree of HTS sequences generated using qiime phylogeny align-to-tree-mafft-fasttree, accepting default parameters. The graphic was rendered using the Interactive Tree Of Life (
In many cases, coarser identifications at genus resolution from the morphology-based dataset corresponded with species identifications from the HTS data. Molecular identifications of Neospondylis upiformis (Mannerheim, 1843), Dolurgus pumilus (Mannerheim, 1843), and Orthotomicus caelatus (Eichhoff, 1868) corresponded exactly with identifcations of these genera based on morphology. Identifications of Thanasimus undatulus (Say, 1835) and Hemicoelus carinatus (Say, 1823) obtained by HTS corresponded to morphological identifications of Cleridae and Ptinidae, respectively. More generally, HTS identfications of Cryphalus ruficollis Hopkins, 1915; Dendroctonus rufipennis Kirby, 1837; Dryocoetes affaber Leconte, 1876; Hylurgops rugipennis (Mannerheim, 1843); and Trypodendron lineatum (Olivier, 1795) mostly corresponded to morphological identifications of these genera.
In the three samples where bycatch was included, 14 species or BINs of flies, the acanthosomatid bug Elasmostethus interstinctus (Linnaeus, 1758), and an ichneumonid wasp identified as Ichneumoninae sp. BOLD:AAU8831 were also identified. Detections of the targeted scolytine and cerambycid beetles were not notably reduced in these samples.
High Throughput Sequencing also yielded detections of nematodes including an ASV identified as Bursaphelenchus sp.
From the perspective of work hours required by our team, the 1.3 hours per sample for processing HTS data was 65% of the 2.1 hours per sample required for identification using morphology.
Discussion
Although HTS methods outperformed morphological identfication methods in this case in terms of taxonomic resolution of identifications, it should be noted that only the initial steps of a typical EDRR processing workflow were followed. If specimens had been sent out to taxonomic specialists, then most bark and wood-boring beetle specimens would have received species-resolution identifications. Obtaining expert identifications would have also substantially increased processing costs and processing time.
In terms of processing time, HTS methods outperformed morphological methods, with HTS methods requiring 65% of the work hours needed for the morphological identifications. However, this does not take into account processing time at the sequencing lab. In this example, results from the morphological dataset were available 4 days after processing was commenced by a team of workeers while HTS methods required 1 day for shipping, 73 days for processing at the sequencing lab, and about 5 work days for metagenomic processing. Both methods returned results before the next growing season, but morphological methods would have allowed for a rapid response in the fall almost 3 months before the results from HTS were available. However, in more recent sampling efforts comparable sequencing has required only 4 weeks from the sequencing lab. Also, HTS processing time per sample should decrease as the sample size is increased because much of the pipeline can be run in parallel.
We did not attempt to quantify rates of false presences and false absences in the HTS dataset, but it was clear that some taxa observed in the morphological dataset and the three known exotic species in particular were not detected by HTS. We were not surprised that the preserved specimens of Ips typographus and Tetropium fuscum were not detected because these specimens may have had degraded DNA and they represented small portions of the samples. We had expected that the live specimen of Halyomorpha halys, a relatively large insect where DNA degredation should not have been a problem, would have been detected. Potential causes for this non-detection include a failure to homogenize the sample completely or failure to amplify sequences of this species due to primer bias.
In any single primer pair, differences in binding to DNA templates lead to amplification biases, affecting both read abundances and detections of species so that any single primer set will lead to detections of a subset of species (
In future applications of HTS for biomonitoring we would consider using the SCVUC COI metabarcode pipeline (https://github.com/EcoBiomics-Zoobiome/SCVUC_COI_metabarcode_pipeline) used by
Notes on selected taxa
Placusa incompleta Sjöberg, 1934 (Coleoptera: Staphylinidae) is a Palearctic rove beetle species adventive in North America was first reported in North America by
Hydrophoria lancifer, a Palearctic species, was introduced into eastern North America in the 1920s and since that time has become established on both coasts, ranging from British Columbia and Washington to New York and Newfoundland (
Even though our sequence of a Tibellus was 100% similar (p-dist) to sequences of Tibellus maritimus (Menge, 1875) and Tibellus oblongus (Walckenaer, 1802) on BOLD, this sequence could not be unequivocally identified as one species or the other becuase these two species are not separable by their COI sequences (
Phaonia luteva (Walker, 1849) was recently resurrected as a species distinct from Phaonia errans (Meigen, 1826) by
Conclusions
Because our HTS methods failed to detect Ips typographus and Tetropium fuscum, two species of concern for our EDRR monitoring program, we do not recommend wholly replacing our current morphological monitoring methods with HTS methods. Even though our morphological identifcations were mostly at the taxonomic resolution of genera, we believe that we would be more likely to detect certain exotic species by using morphology than by using HTS. However, HTS methods would be especially appropriate as a complement to current EDRR methods for survellaince monitoring. Our detections of two new exotic species for Alaska highlight the effectiveness of HTS methods for detecting species that were not being looked for. In addition, because the results of both methods were consistent overall, HTS methods would be appropriate for increasing sample size without greatly increasing the time required to process specimens, especially if bycatch is included, removing the time-consuming manual sorting step.
Acknowledgements
We are grateful to the Yeti team and USGS for use of the Yeti Cluster. We thank Derek Sikes for helpful comments that improved an early draft of this manuscript.
Funding program
This project was funded by the USDA Forest Service, Forest Health Protection, Special Technology Development Program.
References
-
Basic local alignment search tool.Journal of Molecular Biology215(3):403‑410. https://doi.org/10.1016/S0022-2836(05)80360-2
-
Towards a DNA barcode reference database for spiders and arvestmen of Germany.PLOS One11(9):e0162624. https://doi.org/10.1371/journal.pone.0162624
-
Biomonitoring 2.0: a new paradigm in ecosystem assessment made possible by next-generation DNA sequencing.Molecular Ecology21(8):2039‑44. https://doi.org/10.1111/j.1365-294X.2012.05519.x
-
Untangling taxonomy: a DNA barcode reference library for Canadian spiders.Molecular Ecology Resources16(1):325‑341. https://doi.org/10.1111/1755-0998.12444
-
Optimizing taxonomic classification of marker-gene amplicon sequences with QIIME 2's q2-feature-classifier plugin.Microbiome6(1):90. https://doi.org/10.1186/s40168-018-0470-z
-
QIIME 2: Reproducible, interactive, scalable, and extensible microbiome data science.PeerJ Preprints6:e27295v2‑e27295v2. https://doi.org/10.7287/peerj.preprints.27295v2
-
Raw metagenomic data from Early Detection Rapid Response samples collected in Alaska in 2017 [Data set].Zenodo. Release date:2019-6-13. URL: https://doi.org/10.5281/zenodo.3245461
-
DNA metabarcoding of insects and allies: an evaluation of primers and pipelines.Bulletin of Entomological Research105(6):717‑727. https://doi.org/10.1017/S0007485315000681
-
Studying ecosystems with DNA metabarcoding: lessons from aquatic biomonitoring.bioRxivhttps://doi.org/10.1101/578591
-
DADA2: high-resolution sample inference from Illumina amplicon data.Nature Methods13(7):581‑583. https://doi.org/10.1038/nmeth.3869
-
Validation and development of COI metabarcoding primers for freshwater macroinvertebrate ioassessment.Frontiers in Environmental Science5:11. https://doi.org/10.3389/fenvs.2017.00011
-
USGS Yeti Supercomputer.U.S. Geological Surveyhttps://doi.org/10.5066/F7D798MJ
-
Algorithm for post-clustering curation of DNA amplicon data yields reliable biodiversity estimates.Nature Communications8(1):1188. https://doi.org/10.1038/s41467-017-01312-x
-
GBIF Occurrence Download.GBIF.orghttps://doi.org/10.15468/dl.tf4pmj
-
Large-scale biomonitoring of remote and threatened ecosystems via High-Throughput Sequencing.PLOS One10(10):e0138432. https://doi.org/10.1371/journal.pone.0138432
-
Anthomyiidae, Part 2, No. 12. In: Griffiths GCD (Ed.)Flies of the Nearctic Region.8.E. Schweizerbart'sche Verlagsbuchhandlung,Stuttgart.
-
Environmental Barcoding: A Next-Generation Sequencing approach for biomonitoring applications using river benthos.PLOS One6(4):e17497. https://doi.org/10.1371/journal.pone.0017497
-
A new way to contemplate Darwin's tangled bank: how DNA barcodes are reconnecting biodiversity science and biomonitoring.Philosophical Transactions of the Royal Society B: Biological Sciences371(1702). https://doi.org/10.1098/rstb.2015.0330
-
COI metabarcoding primer choice affects richness and recovery of indicator taxa in freshwater systems.bioRxivhttps://doi.org/10.1101/572628
-
Biological identifications through DNA barcodes.Proceedings of the Royal Society of London. Series B: Biological Sciences270(1512):313‑321. https://doi.org/10.1098/rspb.2002.2218
-
The Muscidae of Northern Canada, Alaska, and Greenland (Diptera).Memoirs of the Entomological Society of Canada97(Supplement S42):5‑369. https://doi.org/10.4039/entm9742fv
-
Diversity of Placusa (Coleoptera: Staphylinidae, Aleocharinae) in Canada, with descriptions of two new species.The Canadian Entomologist133(1):1‑47. https://doi.org/10.4039/Ent1331-1
-
Twelve new species and fifty-three new provincial distribution records of Aleocharinae rove beetles of Saskatchewan, Canada (Coleoptera, Staphylinidae).ZooKeys610:45‑112. https://doi.org/10.3897/zookeys.610.9361
-
Studium fylogeneze evropských rodů čeledi Anthomyiidae (Diptera) s novými poznatky o identifikaci, ekologii a rozšíření středoevropských druhů. [A study on the phylogeny of the European genera of Anthomyiidae (Diptera) with new data on identification, ecology and the distribution of the Central European species].Masaryk University,Brno,133pp. [InCzech]. URL: https://is.muni.cz/th/10376/prif_d/
-
A new versatile primer set targeting a short fragment of the mitochondrial COI region for metabarcoding metazoan diversity: application for characterizing coral reef fish gut contents.Frontiers in Zoology10:34. https://doi.org/10.1186/1742-9994-10-34
-
Interactive Tree Of Life (iTOL) v4: recent updates and new developments.Nucleic Acids Researchgkz239https://doi.org/10.1093/nar/gkz239
-
Monitoring for conservation.Trends in Ecology & Evolution21(12):668‑673. https://doi.org/10.1016/j.tree.2006.08.007
-
Strategies and guidelines for scholarly publishing of biodiversity data.Research Ideas and Outcomes3:e12431. https://doi.org/10.3897/rio.3.e12431
-
Observations on anthophilous Muscidae and other Diptera (Insecta) in Abisko National Park, Sweden.Journal of Natural History27(3):631‑643. https://doi.org/10.1080/00222939300770361
-
Early detection and rapid response for non-native bark and ambrosia Beetles.United States Department of Agriculture, Forest Service, Forest Health Protection,vi+12pp. URL: https://www.fs.fed.us/foresthealth/publications/EDRRProjectReport.pdf
-
Forest health in a changing world: effects of globalization and climate change on forest insect and pathogen impacts.Forestry89(3):245‑252. https://doi.org/10.1093/forestry/cpw018
-
BOLD: The Barcode of Life Data System (http://www.barcodinglife.org).Molecular Ecology Notes7(3):355‑364. https://doi.org/10.1111/j.1471-8286.2007.01678.x
-
A DNA-based registry for all animal species: The Barcode Index Number (BIN) system.PLOS One8(7):e66213. https://doi.org/10.1371/journal.pone.0066213
-
R: A language and environment for statistical computing.R Foundation for Statistical Computing,Vienna, Austria.
-
DNA barcoding of Northern Nearctic Muscidae (Diptera) reveals high correspondence between morphological and molecular species limits.BMC Ecology12(1):24. https://doi.org/10.1186/1472-6785-12-24
-
VSEARCH: a versatile open source tool for metagenomics.PeerJ4:e2584‑e2584. https://doi.org/10.7717/peerj.2584
-
SimpleMappr, an online tool to produce publication-quality point maps. https://www.simplemappr.net
-
Open Nomenclature in the biodiversity era.Methods in Ecology and Evolution7(10):1217‑1225. https://doi.org/10.1111/2041-210x.12594
-
Building a DNA barcode library of Alaska’s non-marine arthropods.Genome60(3):248‑259. https://doi.org/10.1139/gen-2015-0203
-
Insect life on plants attacked by aphids.Annales entomologici Fennici2(4):161‑169.
-
DNA metabarcoding as a tool for invertebrate community monitoring: a case study comparison with conventional techniques.Austral Entomologyhttps://doi.org/10.1111/aen.12384
-
New results on Diptera predators in the blackfly plague areas of Central Europe and the Caucasus.Acta entomologica serbicaSupplement:131‑140. URL: http://www.eds.org.rs/AES/Vol11Suppl/16.pdf
-
Observations on the Diptera and other insects frequenting sap exudations on an oak tree in Devon, south-west England.Dipterists Digest23(2):119‑136. URL: http://www.dipteristsforum.org.uk/sgb_dipterists_digest.php?id=61
Supplementary materials
This file contains the specimen data from the original trap samples, morphological identifications, molecular identifications, and resulting occurrence data.
Amplicon sequence variant table in standard text format
Sequences of amplicon sequence variants in FASTA format.