|
Research Ideas and Outcomes : Workshop Report
|
|
Corresponding author: Joel Sachs (joel.sachs@agr.gc.ca), Jocelyn Pender (pender.jocelyn@gmail.com)
Received: 13 May 2019 | Published: 27 May 2019
This is an open access article distributed under the terms of the CC0 Public Domain Dedication.
Citation: Sachs J, Page R, Baskauf S, Pender J, Lujan-Toro B, Macklin J, Comspon Z () Training and hackathon on building biodiversity knowledge graphs. . https://doi.org/
|
|
Abstract
Knowledge graphs have the potential to unite disconnected digitized biodiversity data, and there are a number of efforts underway to build biodiversity knowledge graphs. More generally, the recent popularity of knowledge graphs, driven in part by the advent and success of the Google Knowledge Graph, has breathed life into the ongoing development of semantic web infrastructure and prototypes in the biodiversity informatics community. We describe a one week training event and hackathon that focused on applying three specific knowledge graph technologies – the Neptune graph database; Metaphactory; and Wikidata - to a diverse set of biodiversity use cases.
We give an overview of the training, the projects that were advanced throughout the week, and the critical discussions that emerged. We believe that the main barriers towards adoption of biodiversity knowledge graphs are the lack of understanding of knowledge graphs and the lack of adoption of shared unique identifiers. Furthermore, we believe an important advancement in the outlook of knowledge graph development is the emergence of Wikidata as an identifier broker and as a scoping tool. To remedy the current barriers towards biodiversity knowledge graph development, we recommend continued discussions at workshops and at conferences, which we expect to increase awareness and adoption of knowledge graph technologies.
Keywords
Biodiversity knowledge graph; linked open data; biodiversity informatics; Neptune; Metaphactory; Wikidata; graph database; RDF; SPARQL
Date and place
The workshop was held at Agriculture and Agri-Food Canada’s Experimental Farm in Ottawa, Ontario, Canada from Oct. 15 to 19, 2018.
List of participants
Table
List of participants at the workshop.
| Participant | Institution |
| Peter Haase (Instructor) | Metaphactory |
| Joel Sachs | Agriculture and Agri-Food Canada |
| James Macklin | Agriculture and Agri-Food Canada |
| Jocelyn Pender | Agriculture and Agri-Food Canada |
| Beatriz Lujan-Toro | Agriculture and Agri-Food Canada |
| Rod Page | University of Glasgow |
| Steve Baskauf | Vanderbilt University |
| Zacchaeus Compson | University of New Brunswick |
| Melanie Belisle-Leclerc | Agriculture and Agri-Food Canada |
| Karen Cranston | Agriculture and Agri-Food Canada |
| Christian Gendreau | Agriculture and Agri-Food Canada |
| Oksana Korol | Agriculture and Agri-Food Canada |
| Guillaume Bilodeau | Canadian Food Inspection Agency |
| Devon Redford | Agriculture and Agri-Food Canada |
| Terri Porter | National Research Council |
| Mariya Dimitrova | Pensoft Publishers |
Introduction
Natural Science collection digitization, genomic sample sequencing, and field survey data collection have accelerated in pace in recent years, thanks to focused investments and increasing efficiency of workflows, among other factors (
The need for dataset integration has led biodiversity scientists in search of solutions. Here, we describe a workshop that brought together biodiversity data professionals of diverse backgrounds to explore the utility of biodiversity knowledge graphs. Knowledge graphs unite data silos using linked data technologies. On the semantic web, knowledge graphs are constructed using the Resource Description Framework (RDF) - a family of W3C specifications in which graphs are specified by collections of <subject, predicate, object> triples. The subjects and objects represent nodes in the graph, and the predicates represent directed arcs from subjects into objects. Objects can be either literals or URIs, but subjects and predicates must be URIs. It is this final requirement that glues RDF graphs to other RDF graphs, and which puts the “web” in semantic web.
The purpose of our workshop was to explore the integration of linked, open datasets toward the development of biodiversity knowledge graphs, the feasibility and status of building a single biodiversity knowledge graph resource, and to explore several use cases for the development and application of these graphs. First, we held hands-on sessions where participants learned how to access and utilize the AWS Neptune graph database within the Metaphactory suite of tools (
Specific workshop aims
Knowledge graphs
One observation that emerged from our workshop was that there is a lack of understanding of knowledge graph utility for biodiversity science. This knowledge gap was addressed through training sessions before we began exploring tools and our case studies. Additionally, participants of the workshop sought to better understand what problems or use cases are well suited to the use of triplestores. Thus, a central goal of the workshop became to learn about knowledge graphs. We wanted to understand what opportunities building knowledge graphs could bring and how to use modern technologies, like Neptune, Blazegraph and Metaphactory to set one up.
We explored the state of interoperability amongst biodiversity knowledge graphs. If we imagine the hypothetical federation of all biodiversity knowledge graphs, how well connected it is the resulting unified graph? A graph is connected if there exists a path between every two nodes. The more paths that exist, the higher the connectivity, and the less siloed the data (see the Glossary for a precise definition of graph connectivity). A key interest of workshop participants was contributing to general purpose biodiversity knowledge graph infrastructure.
Use cases
We sought to accomplish our learning goals by exploring and advancing three separate products:
-
Expanding the scope of Ozymandias, a biodiversity knowledge graph of Australian fauna (
Page 2018 ) -
Investigating the use of Wikidata as a component of the Integrated Flora of Canada (
Pender et al. 2018 ) - Exploring the use of knowledge graphs for heuristic food webs (Compson et al., unpublished data)
This structure allowed us to solicit feedback on our work and advance our projects in an exploratory and collaborative fashion (i.e., through instantaneously implementing various ideas that arose).
Ozymandias
Rod Page has assembled a knowledge graph that incorporates a classification of the Australian fauna (via the Atlas of Living Australia), associated taxonomic names and publications (from the Australian Faunal Directory), augmented by data from BioStor (
Integrated Flora of Canada
The hosts of the workshop at Agriculture and Agri-Food Canada (Joel Sachs, James Macklin, Jocelyn Pender, Beatriz Lujan-Toro) are working on an Integrated Flora of Canada resource, based on their Semantic MediaWiki representation of Flora of North America (
Food webs
Zacchaeus Compson is leading a project that aims to create trait-based food webs (or heuristic food webs) by combining taxa lists generated from DNA metabarcoding with traits that are found in literature using text mining. Visualizing food webs requires knowledge of taxa and their trophic habits, but sampling limitations and a lack of readily available prior knowledge make this challenging. Recent advances in genomics and computational analysis show promise for overcoming some of these challenges. Using DNA to characterize the composition of communities can be effective because it is non-invasive, sensitive, and provides a standardized detection method that circumvents the need for trained taxonomists. Meanwhile, text-mining provides a method for targeted data-mining, allowing trait data to be gathered for specific taxa across large PDF databases (e.g., Google Scholar, Web of Science). We used a scalable engine for semantic automatic discovery and integration to query online databases for knowledge on benthic macroinvertebrate traits (e.g., trophic links, body size). Previously, we have generated heuristic food webs using taxon lists from matched DNA and morphology samples for the Peace and Athabasca River deltas in the Mackenzie Basin, Alberta, Canada, and have explored how metrics of these food webs vary through space and time. In
Workshop outcomes
Knowledge graphs and linked open data
During the training part of the workshop, we explored knowledge graphs and the graph data model. Graphs differ from the traditional relational data model in several keys ways, which enable knowledge representation and integration. First, graph databases place an emphasis on relationships between entities, which may be real world objects or abstract concepts, stored as structured or unstructured data. This is useful for representing biological heterogeneous and integrated datasets (
Linked open data (LOD) was also explored at the training. LOD principles are a set of standards, principles for publishing, sharing, and interrelating structured knowledge that help break down data silos and create a “Web of Data". Following these principles extends the utility of data in a knowledge graph: data can be integrated and reused via semantic queries. Through a series of demos using tools on the Metaphactory platform, Peter Haase demonstrated how to use identifier matching (most ideal scenario) or string matching (least ideal scenario, due to disambiguation problems) to unite existing datasets (e.g., the neXtProt database) with other freely available datasets (e.g., Wikidata). Queries or visualizations could then be constructed and developed that would be difficult or impossible to build with the individual datasets alone. There are an increasing number of externally available datasets to connect to, especially in the life sciences, as can be seen in the LOD cloud (https://lod-cloud.net/).
Following the demonstration of neXtProt and Wikidata integration, our goal was to integrate our use case datasets (i.e., Ozymandias, Integrated Flora of Canada, trait-based food webs) and external datasets (e.g., Wikidata and metagenomic data). Before this could occur, however, we needed to convert the use case datasets into a graph by conversion to RDF. This required using tools to convert CSV and XML files into RDF so that they could be loaded into the Metaphactory triplestore. Important obstacles to overcome included (1) converting data into RDF, (2) establishing links between our data and other datasets to enhance content, and, importantly, (3) determining shared identifiers. As a result of our experiences, at the workshop and otherwise, we believe that the absence of shared identifiers to make links is the most problematic barrier to adoption of LOD today.
An obvious driver towards realizing a biodiversity knowledge graph is its potential to generate metrics demonstrating the efforts and value of collections and biodiversity scientists. Often overlooked and undervalued, the work of biodiversity scientists is not adequately represented by existing metrics (
Wikidata and Wikibase
We also explored the utility of Wikidata. The central goal of Wikidata is to allow users to query all knowledge contained within Wikipedia, a significant knowledge base and the sixth most popular website globally (
Wikidata discussions focused on its utility as an “identity broker”. Wikidata provides a comprehensive list of item identifiers collected collaboratively from across the web. This is a significant development in the world of linked data, because mapping identifiers to identifiers is a laborious task, and the absence of shared identifiers is a major barrier to the adoption of LOD technology. Due to its collaborative nature, Wikidata is also powerful for "property scoping", or reaching consensus on properties for a certain type of object. The limitations of Wikidata for biodiversity data were also discussed, including its inability to distinguish between a name and a "taxon concept".
We also investigated the use of Wikibase, the software that powers Wikidata, for the Integrated Flora of Canada project. In particular, we saw potential in the data attribution capabilities of Wikibase through the use of “qualifiers”, as well as the collaborative functionality. During the “hacking” phase of the workshop, we discovered a blog post outlining the steps to getting a local Wikibase instance up and running (https://medium.com/@thisismattmiller/wikibase-for-research-infrastructure-part-1-d3f640dfad34). This provided us with a starting point for continuing our post-workshop investigations of Wikibase.
Associated technology
This was a hands-on workshop, and a focus was placed on learning new technologies. We learned how to set up a Metaphactory instance using AWS directly, how to write SPARQL queries, how to write and interpret Turtle syntax, and how to construct federated queries out of Neptune using Ephedra. Additionally, we learned how to use Metaphactory's powerful visualization tool, which allows users to build bubble graphs, maps, and various types of charts from SPARQL queries on loaded datasets directly. In parallel, we shared useful tools (e.g.,Kitematic for fast Docker container deployment, sloppy.io for Docker hosting, Fuseki as a SPARQL server, W3C validator for RDF XML, BaseX for XML database management, d3sparql.js for building visualizations directly from SPARQL queries).
We discussed the uses of different database technologies (relational, non-relational, graph, etc.). Importantly, we discussed the challenges of data curation, which requires a majority of the effort to build a dataset, and no technological solution will change this. Instead, we asked how we can share data curation efforts so that they never need to be duplicated.
Use cases
Ozymandias
The biggest challenge in adding specimen data ("occurrences") to Ozymandias is deciding how to model occurrences. One approach is to treat occurrence records as "flat" data structures, in much the same way that occurrence data is currently served by GBIF. Existing RDF providers, such as members of the Consortium of European Taxonomic Facilities (CETAF), adopt this approach (
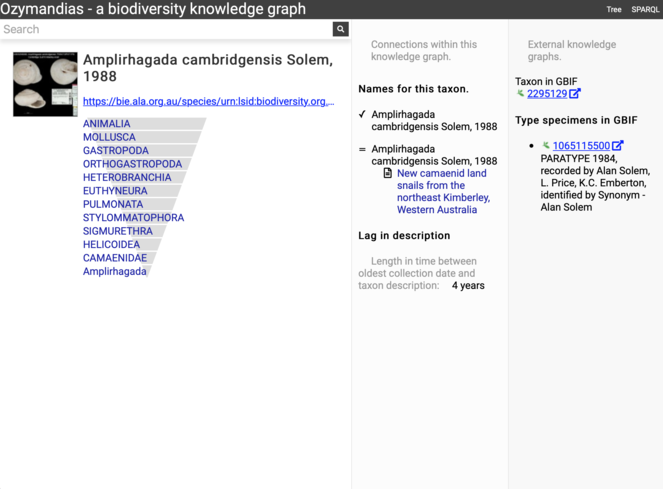
Screenshot of Ozymandias displaying information for the snail Amplirhagada cambridgensis (taxon https://bie.ala.org.au/species/urn:lsid:biodiversity.org.au:afd.taxon:3b488c3b-b55c-47ef-b624-43d1038c6e6d). The data in this display is generated from SPARQL queries to the underlying knolwedge graph. The addition of occurrence data from GBIF in this workshop makes it possible to compute the lag between species collection and description (in this case four years).
Integrated Flora of Canada
At the workshop, the Integrated Flora of Canada team developed a wish list of data integrations for the future platform, explicitly outlining identifier and data providers. In addition, we worked on developing federated SPARQL queries that used Wikidata and Uniprot SPARQL endpoints to discover and collect sequence and reference data. Using these queries as a starting point, discussions around the added capabilities of a flora with up-to-date sequence and reference information ensued. For example, with updated references, one could construct a reference timeline. This would allow us to ask questions such as, “is research on a particular taxon still ongoing?”, and if so, “who are the current experts?” This has applications for directing treatment revisions to the most appropriate botanists.
Additionally, one of the outcomes for the Integrated Flora of Canada project was clarifying its value proposition. There are many services available online that aggregate data from elsewhere. What the Integrated Flora of Canada provides, beyond aggregating relevant resources, is parsed morphological data from flora documents, which we are currently working to prepare. Once complete, the user will be able to query quantitative and qualitative properties (e.g., leaf coloration), across all taxa represented in the flora.
Stimulating discussions about the future of floras were also part of the workshop. For example, how far away are we from automatically generated floras using existing data sources? Can we generate treatments on the fly as a database query?
Lastly, we hacked at our existing Flora of North America data to convert it into RDF and to experiment with Metaphactory as a platform for hosting our data. The source data was an XML file Suppl. material
PREFIX bios: <http://www.github.com/biosemantics/>
PREFIX rdfs: <http://www.w3.org/2000/01/rdf-schema#>
SELECT DISTINCT ?name ?description
WHERE {
?treatment rdfs:label ?name.
?treatment bios:hasMajorPart ?major.
FILTER(CONTAINS(?description, "yellow"))
OPTIONAL {
?major bios:majorDescription ?description.
?major bios:majorName "petals".
}
OPTIONAL {
?major bios:hasMinorPart ?minor.
?minor bios:minorDescription ?description.
?minor bios:minorName "petals".
}
}
One appealing feature of the Metaphactory platform is that it can generate graph diagrams from data based on screening criteria specified by graph patterns in SPARQL CONSTRUCT queries. To generate the diagram, a page is created using Metaphactory's semantic-map page template by enclosing the query within a <semantic-graph> XML element:
<semantic-graph height="1000" query="
[insert query here]
"></semantic-graph>
In doing this, we were able to generate a diagram visualizing the paths that one could take to arrive at a determination using the Cucurbitaceae key present in the treatment (Fig.
The primary limitation of modelling our data in RDF was the inability to order nodes (i.e., we were unable to designate the 1st discussion node, 2nd discussion node, and 3rd discussion node in order). However, we learned what Metaphactory could afford us in terms of semantic property searches, including semantic auto suggestion, faceted search and exploration of item collections, and translation of keyword queries into SPARQL queries.
Food webs
In order to use the Metaphactory tools to visualize food web data from the Peace-Athabasca Delta, it was necessary to convert data from several spreadsheets into RDF. Within the spreadsheets, some columns contained identifiers linking the described consumer to known resources. Other columns contained metadata about the consumers and resources. Whenever possible, the metadata columns were mapped to well-known vocabulary terms in the Darwin Core, Dublin Core, or RDF Schema (RDFS) vocabularies. After establishing the mappings, an RDF graph was created for each spreadsheet using CSV to RDF conversion software (
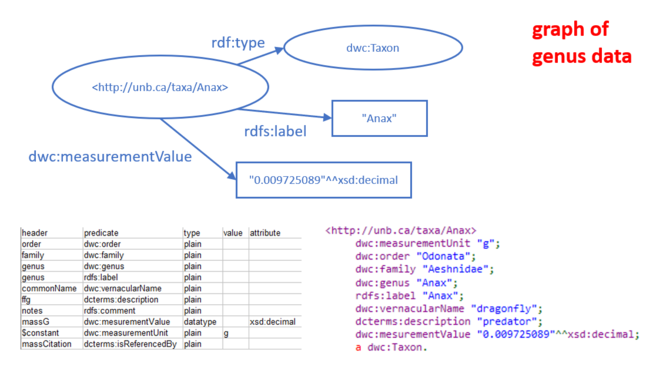
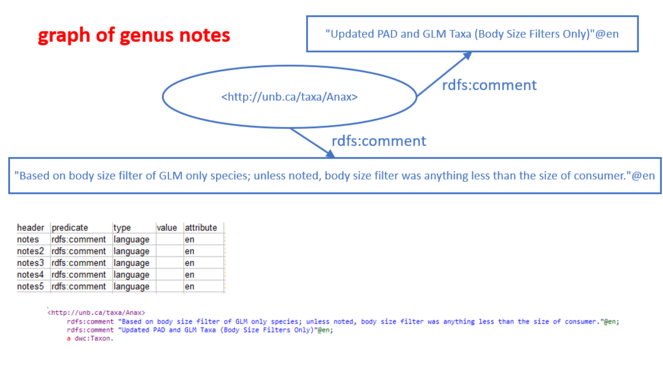
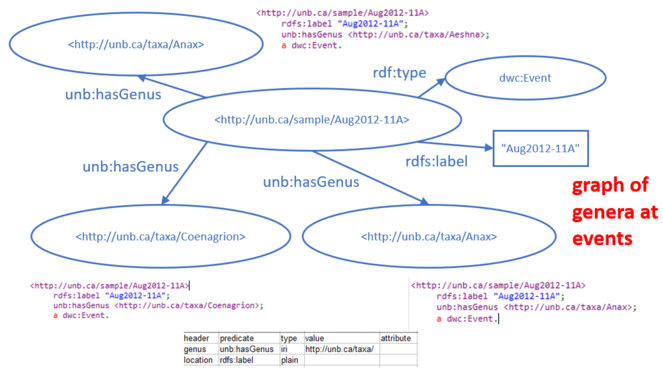
The specific data converted to RDF is shown in Figs. 3 through 6. The spreadsheet containing basic data about genera included in the study included columns whose headers are shown in the table at the lower left of Fig.
The food web data were collected during sampling events (i.e., collected at a particular location on a particular date; see Compson et al. 2018 for details). A CSV table with two columns related genera to the event at which they were observed. The link from event to genus present was made with a made-up predicate "unb:hasGenus", and a fake URI for the event was made by appending the event code to the namespace "http://unb.ca/sample/". The graph resulting from this spreadsheet is illustrated in Fig.
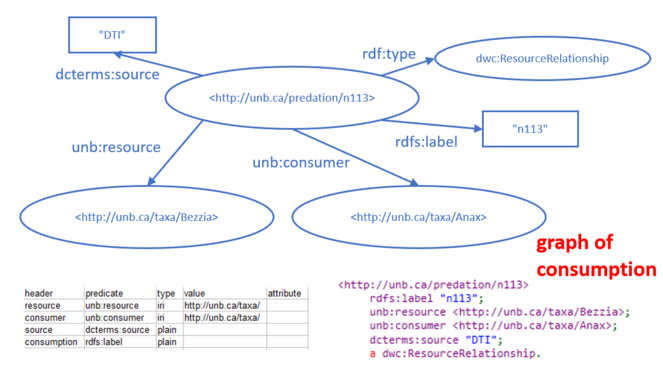
The actual food web relations were contained in a fourth CSV table. Each row of the table documented a known predation relationship, with columns stating the participants in the relationship (consumer and resource), a code for the source of the information, and a locally unique identifier for the relationship. The predation relationship was defined in RDF by linking the predation event to the consumer via the made-up predicate "unb:consumer" and to the resource it consumed by the made-up predicate "unb:resource". An example of one predation relationship is shown in Fig.
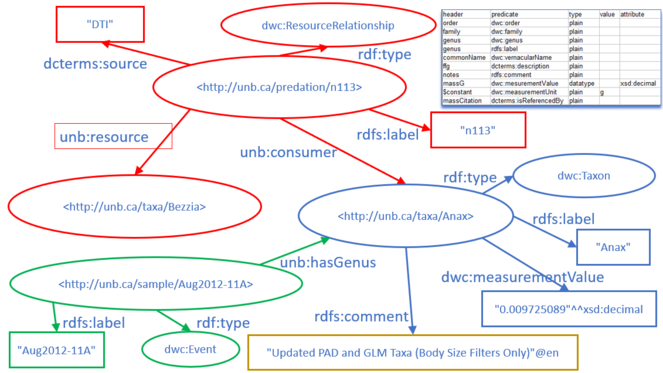
After each of the CSV spreadsheets was converted to RDF/Turtle, the four graphs were loaded into the Metaphactory triplestore to create a single graph that was the union of the four graphs. A small portion of the merged graph is shown in Fig.
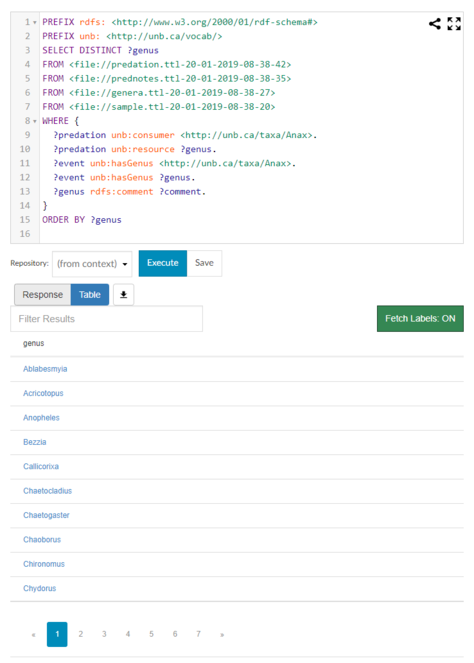
Once the four RDF/Turtle files generated from the spreadsheets were loaded into the Metaphactory triplestore, it was possible to construct SPARQL queries to ask questions that could not be answered by examining a single spreadsheet. For example, the query in Fig.
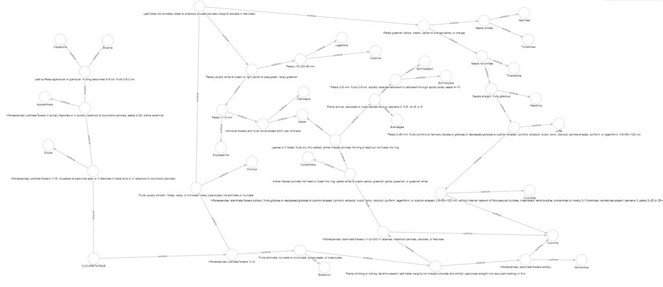
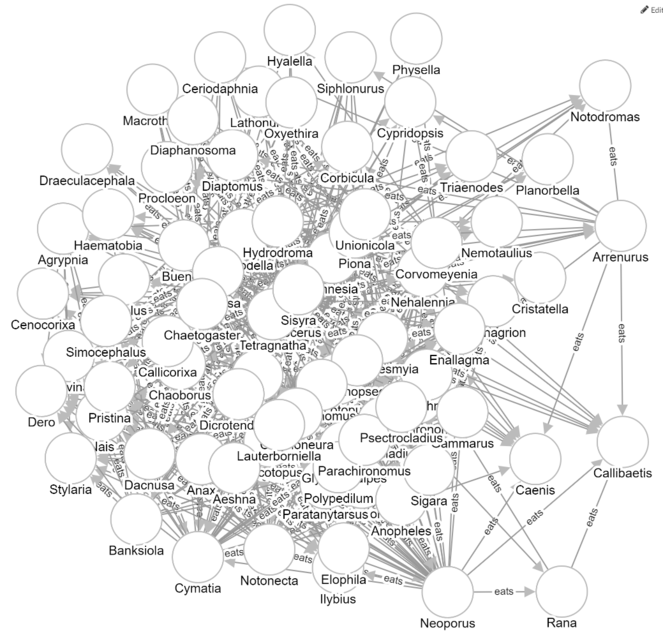
The semantic-graph feature of Metaphactory can be used to create a visualization of all of the predation relationships that might be present among genera that were present in a particular sampling event. For example, a diagram for the Aug2012-11A event can be generated using the following query:
PREFIX unb: <http://unb.ca/vocab/>
CONSTRUCT {
?consumer :eats ?resource.
}
WHERE {
<http://unb.ca/sample/Aug2012-11A> unb:hasGenus ?consumer.
<http://unb.ca/sample/Aug2012-11A> unb:hasGenus ?resource.
?relationship unb:consumer ?consumer.
?relationship unb:resource ?resource.
}
where :eats is a made-up predicate that connects a consumer directly to a resource.
The resulting visualization is shown in Fig.
We created a more meaningful visualization by restricting the display to parts of the web that met particular criteria. For example, consider the case where genus1 eats genus2, which eats genus3, which eats genus4. For genera present in the Aug2012-11A sampling event, we can ask “in what cases does genus1 also eat genus3 and genus4?” In other words, are there cases where a genus eats broadly down the food chain? To answer this question, we set up the following page template:
<semantic-graph height="1000" query="
PREFIX unb: <http://unb.ca/vocab/>
CONSTRUCT {
?consumer :eats ?resource1.
?consumer :eats ?resource2.
?consumer :eats ?resource3.
?resource1 :eats ?resource2.
?resource2 :eats ?resource3.
}
WHERE {
?relationship1 unb:consumer ?consumer.
?relationship1 unb:resource ?resource1.
?relationship2 unb:consumer ?consumer.
?relationship2 unb:resource ?resource2.
?relationship2 unb:consumer ?consumer.
?relationship2 unb:resource ?resource3.
?relationship3 unb:consumer ?resource1.
?relationship3 unb:resource ?resource2.
?relationship4 unb:consumer ?resource2.
?relationship4 unb:resource ?resource3.
}
">
</semantic-graph>
Fig.
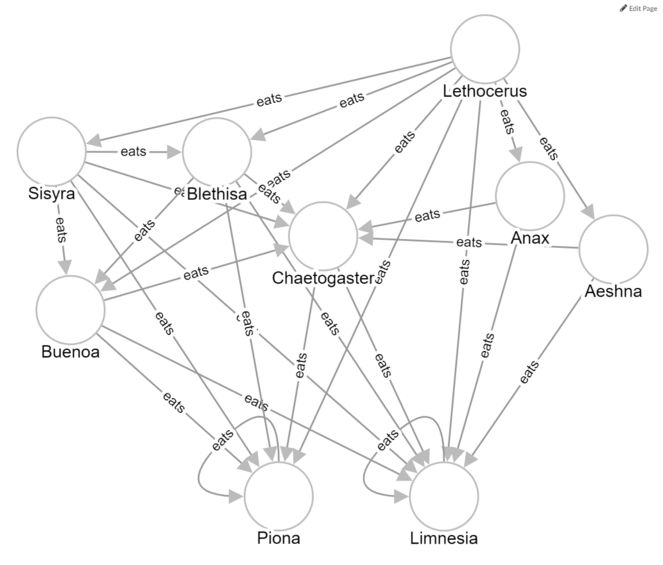
These exercises and visualizations illustrate that the utility of Metaphactory as a data exploration tool is only limited by our ability to imagine SPARQL queries that reflect interesting ecological questions that we might want to ask about the food webs. Additionally, Metaphactory’s use as a food web visualization tool is restricted when the amount of information displayed is too great.
Discussion questions
While the focus of the workshop was training and advancing individual projects, key discussion questions arose. Some of these originated from the relative inexperience of participants, and others from the considerable experience and cynicism of other participants. Most of these questions are unresolved, and the authors invite readers to engage in an ongoing discussion via post-publication review. Here we present our consensus views.
How can we do a better job at showcasing the utility of knowledge graphs?
We believe tools like Metaphactory can help to showcase the utility of knowledge graphs.
Is unfamiliarity with the SPARQL query language a barrier for the biodiversity informatics community towards adopting biodiversity knowledge graphs?
Undoubtedly, SPARQL is a much more niche query language than SQL. Therefore, we believe unfamiliarity with SPARQL is a barrier. The cultivation of communities of practice within scientific disciplines, achieved through workshops and breakouts at conferences, would help to mitigate this issue. As previously stated, more user friendly front-end interfaces are needed, such as those provided by Metaphactory.
Does Wikidata change the outlook of building a united biodiversity knowledge graph?
Wikidata acts as identifier broker. Wikidata has the potential to contribute to consensus-based term definitions, via its collaborative property pages.
Is the lack of a single access point to the “biodiversity knowledge graph” a limiting factor in demonstrating the utility of integrated data? If so, is this a technological barrier or a social barrier (i.e., who will build the access point)?
A participant of the hackathon and active member of the biodiversity informatics community, Steve Baskauf, argues that it is hard to do anything meaningful when data are scattered across multiple endpoints (
How can we advance our cause of developing shared identifiers?
The success of shared identifier adoption has varied across domains. Some domains are easy, for example ORCIDs have been widely adopted for the identification of people (authors and contributors). Some are slightly harder, for example DOIs are often used to identify publications. Some really seem to resist consensus. Notably, agreement on taxon concept identifiers has not been reached, and there are multiple schemes in existence (e.g., LSIDs, NCBI taxonomy identifiers, Catalogue of Life identifiers). This is compounded by the lack of clarity on the difference between taxa and taxon concepts (i.e., some services conflate the two, others differentiate them with separate identifiers). Further, taxonomy, which is continually being refined and updated, can make make the adoption of universal identifiers for a taxon concept difficult. This is especially true in the microbial sciences, where species concepts are obfuscated by horizontal gene transfer and rapid evolution. Wikidata helps as an identifier broker, but only on straightforward cases. Identifiers for traits are similarly lacking. A trait like “body size” can have many different names and units for the same entity.
What other data sources should be linked to the biodiversity knowledge graph but can't easily be linked?
This depends on what we want our knowledge graphs to do. If we are interested in building heuristic food webs, we would want to link to traits databases, particularly those that report trophic linkages, such as the Database of Trophic Interactions, the USGS Traits Database, or the Global Biotic Interactions database. However, linking to these and other traits databases that have added trait information (e.g., body size and other life history information) could radically expand the utility of knowledge graphs beyond ecological network applications, making these tools much more appealing to people in disparate fields of the natural sciences. Some of the key traits and trophic linkage databases are below:
- Database of Trophic Interactions (DTI)
- USGS Traits Database
- Global Biotic Interactions (GLOBI)
- Encyclopedia of Life
- IsoScape (natural abundance stable isotope repository)
Would the knowledge graph scale?
This question prompted further questions: (1) Can consensus around identifier schemes be achieved amongst all producers of biodiversity data? and (2) Can we develop consensus around semantics and definitions of terms? Computing resources (for federation over the internet; reasoning; graph traversal, etc.), alongside consensus development, may be a limiting factor in the feasibility of a knowledge graph at scale.
Are the pieces that we are trying to merge into a knowledge graph incompatible because they are based on different graph models? Do we need agreement on data models to build a biodiversity knowledge graph?
Even when we agree on the data model, things are very fragile. For example, although data providers may agree to use RDF, vocabularies and shared identifiers may be used inconsistently (
Conclusions
To unite our data silos in biodiversity science, we need agreement and adoption of a data modelling framework. A knowledge graph built using RDF, supported by an identity broker such as Wikidata, has the potential to link data and change the way biodiversity science is conducted. For example, in the future floral treatments may be created on the fly as biodiversity knowledge graph queries, and may replace existing botany workflows.
Biodiversity scientists are only beginning to understand the value and utility of constructing a common knowledge graph. While workshop members have pursued independent projects working towards prototype systems (e.g., Ozymandias, the Integrated Flora of Canada), there is still a lack of adoption of shared identifiers and RDF-formatted data. The value of a biodiversity knowledge graph should continue to be demonstrated by use cases, and discussions should continue as the data available grows. Questions that remain include understanding how knowledge graphs scale and how to maintain updated and accurate datasets that feed knowledge graphs. Moving forward, we aim to continue conversations at the Biodiversity_Next conference in 2019 in Leiden, the Netherlands, or at an alternate venue and date. We will also investigate setting up a Wikidata challenge or workshop at the conference, to broaden participation in our discussions of biodiversity knowledge graphs.
Glossary
AWS: Amazon Web Services, a cloud computing service that provides hosting of computational resources
A Biodiversity Knowledge Graph: biodiversity knowledge organized in a graph form, including data related to specimens, images, people and publications, and their relationships. Represents data using common identifiers and open standards such as the W3C’s RDF and TDWG’s Darwin Core to facilitate data integration.
The Biodiversity Knowledge Graph: The hypothetical federation of all biodiversity knowledge graphs. In theory, this is what everyone working on individual biodiversity knowledge graphs is working towards, and contributing to.
Blazegraph: a triplestore and graph database, used in the Wikidata SPARQL endpoint
Connected graph: A graph in which a path exists between any two nodes.
Connectivity: The minimum number of vertices that need to be deleted to render a graph disconnected. An unconnected graph (connectivity=0) represents data that is still siloed. Intuitively, the higher the connectivity of a knowledge graph, the less siloed the data is.
CETAF: the Consortium of European Taxonomic Facilities
CSV: Comma Separated Values delimited text file
Darwin Core: a standard maintained by the Biodiversity Information Standards (TDWG) group, that includes a glossary of terms facilitating the sharing of biodiversity data
Dublin Core: a glossary of terms that can be used to describe digital and physical resources maintained by the Dublin Core Metadata Initiative (dublincore.org)
Ephedra: a SPARQL federation engine aimed at processing hybrid queries that forms a part of the Metaphactory platform (metaphacts.com/product)
Federated query: A SPARQL query whose graph pattern includes triple patterns present at different SPARQL endpoints.
GBIF: Global Biodiversity Information Facility (gbif.org)
Graph Database: a database that models data in graph form, with objects represented by vertices, and relationships between objects represented by edges.
Knowledge Graph: knowledge stored in graph form, with a focus on the unification of knowledge silos through the use of common identifiers and open standards. In our case, a knowledge graph uses URIs to identify objects (vertices) and properties (edges), and the RDF as the data definition language.
Linked Open Data: open structured data that utilizes standards technologies (e.g., RDF, URIs), so that it can be interlinked to other data sources and can be queried
Metaphactory: a knowledge graph management platform
Neptune: a graph database product, offered as part of Amazon Web Services
RDF: the Resource Description Framework, a set of World Wide Web Consortium (W3C) specifications for describing and modelling metadata, often used in knowledge graphs and to model linked open data
SPARQL: an RDF query language, a key technology of the semantic web
Triplestore: a database for storage and queries of RDF data or triples. A triple is a data entity composed of subject-predicate-object
Triple: data modelled in a subject-predicate-object format
Turtle: a syntax and file format for representing RDF data
URI: Uniform Resource Identifier, a string that unambiguously identifies an entity using a defined naming scheme. Used with the RDF specifications
W3C: World Wide Web Consortium
Wikibase: a freely available set of MediaWiki extensions that can be used to manage versioned data and allow for data collaboration in a central data repository
Wikidata: a collaborative knowledge base offering data provenance and other features, hosted by the Wikimedia foundation and supporting Wikipedia
XML: eXtensible Markup Language, a data storage file format recommended by the W3C
References
-
DBpedia: A nucleus for a Web of Open Data.Lecture Notes in Computer Science.722-735pp. https://doi.org/10.1007/978-3-540-76298-0_52
-
Guid-O-Matic goes to China. (blog post). http://baskauf.blogspot.com/2016/10/guid-o-matic-goes-to-china.html. Accessed on: 2019-1-20.
-
Linked Data Magic and Big Data. http://baskauf.blogspot.com/2016/10/linked-data-magic-and-big-data.html. Accessed on: 2019-3-31.
-
Darwin-SW: Darwin Core-based terms for expressing biodiversity data as RDF.Semantic Web7(6):629‑643. https://doi.org/10.3233/sw-150203
-
Beyond the data deluge.Science323(5919):1297‑1298. https://doi.org/10.1126/science.1170411
-
Linking DNA metabarcoding and text mining to create network-based biomonitoring tools: A case study on boreal wetland nacroinvertebrate communities.Advances in Ecological Research59:33‑74. https://doi.org/10.1016/bs.aecr.2018.09.001
-
Semantic annotation of morphological descriptions: an overall strategy.BMC Bioinformatics11(1):278. https://doi.org/10.1186/1471-2105-11-278
-
Copyright and the use of images as biodiversity data.Research Ideas and Outcomes3:e12502. https://doi.org/10.3897/rio.3.e12502
-
21 years of shelf life between discovery and description of new species.Current Biology22(22):R943‑R944. https://doi.org/10.1016/j.cub.2012.10.029
-
Actionable, long-term stable and semantic web compatible identifiers for access to biological collection objects.Database2017https://doi.org/10.1093/database/bax003
-
metaphactory: A platform for knowledge graph management.Semantic Web.
-
The data deluge: An e‐science perspective. In: Berman F, Fox G, Hey T (Eds)Grid computing: Making the global infrastructure a reality.Wiley,106pp. [ISBN978-0-470-85319-1].
-
Global Biodiversity Informatics Outlook: Delivering biodiversity knowledge in the information age.Global Biodiversity Information Facility (Secretariat)[ISBN8792020526]
-
neXtProt: a knowledge platform for human proteins.Nucleic Acids Research40:D76‑D83. https://doi.org/10.1093/nar/gkr1179
-
Biology needs a modern assessment system for professional productivity.BioScience61(8):619‑625. https://doi.org/10.1525/bio.2011.61.8.8
-
Linked Data That Isn't: the Failings of RDF. http://iphylo.blogspot.com/2011/09/linked-data-that-isn-failings-of-rdf.html. Accessed on: 2019-3-31.
-
Extracting scientific articles from a large digital archive: BioStor and the Biodiversity Heritage Library.BMC Bioinformatics12(1):187. https://doi.org/10.1186/1471-2105-12-187
-
Towards a biodiversity knowledge graph.Research Ideas and Outcomes2:e8767. https://doi.org/10.3897/rio.2.e8767
-
Ozymandias: A biodiversity knowledge graph.bioRxiv485854. https://doi.org/10.1101/485854
-
Bringing a Semantic MediaWiki Flora to Life.Biodiversity Information Science and Standards2:e25885. https://doi.org/10.3897/biss.2.25885
-
New camaenid land snails from the northeast Kimberley, Western Australia.Journal of the Malacological Society of Australia9(1):27‑58. https://doi.org/10.1080/00852988.1988.10673998
-
Triple Pattern Fragments: A low-cost knowledge graph interface for the Web.Journal of Web Semantics184‑206. https://doi.org/10.1016/j.websem.2016.03.003
-
Use of graph database for the integration of heterogeneous biological data.Genomics & Informatics15(1):19. https://doi.org/10.5808/gi.2017.15.1.19
Supplementary materials
The data in this XML file was used to generate the textual treatment of Cucurbitaceae at http://beta.floranorthamerica.org/wiki/Cucurbitaceae using the Semantic MediaWiki platform.
Download file (24.70 kb)
This script was written in XQuery and processed using the BaseX XQuery processor
Download file (10.52 kb)
The taxonomic treatment was written by Guy L. Nesom with the conversion to RDF by Steven J. Baskauf
Download file (33.76 kb)