|
Research Ideas and Outcomes : R Package
|
|
Corresponding author: Giulio Genova (giulio.genova@eurac.edu)
Received: 02 May 2019 | Published: 21 Jun 2019
© 2019 Giulio Genova, Mattia Rossi, Georg Niedrist, Stefano Della Chiesa
This is an open access article distributed under the terms of the Creative Commons Attribution License (CC BY 4.0), which permits unrestricted use, distribution, and reproduction in any medium, provided the original author and source are credited.
Citation: Genova G, Rossi M, Niedrist G, Della Chiesa S (2019) Meteo Browser South Tyrol: A Shiny App to download the meteorological time series from the Open Data Catalogue of the Province of Bolzano/Bozen - Italy. Research Ideas and Outcomes 5: e35894. https://doi.org/10.3897/rio.5.e35894
|
|
Abstract
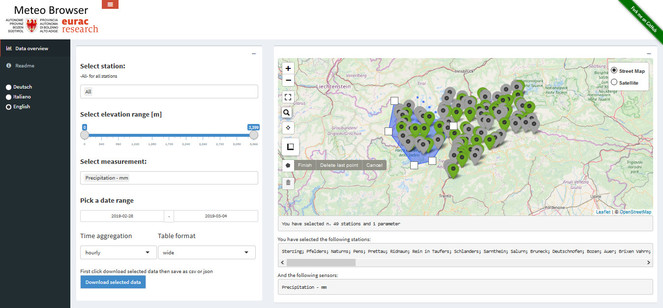
Meteo Browser South Tyrol is a user-friendly web-based application that helps to visualize and download the hydro-meteorological time series freely available in South Tyrol, Italy. It is designed for a wide range of users, from common citizens to students as well as researchers, private companies and the public administration. Meteo Browser South Tyrol is a Shiny App inside an R package and can be used on a local machine or accessed on-line. Drop down menus allow the user to select hydro-meteorological station and measurements. A simple map shows where the monitoring stations are, the latest measurements available, and lets the user subset the selected stations geographically by drawing a polygon.
Keywords
Open Data; Shiny; Hydrology; Meteo; Leaflet; South Tyrol
Introduction
Promoting open data framework with a comprehensive data infrastructure increases publicly available knowledge and provides new unexplored benefits (
The Open Data catalogue of South Tyrol is a bilingual (Italian and German) public database with a large variety of local data and aims to facilitate data search and data re-usability. The Meteo section of the Open Data catalogue contains several meteorological and hydrological variables coming from 120 real-time monitoring stations. Precisely, measurements of air temperature, air humidity, precipitation, wind speed, wind direction, solar radiation, hours of sunlight, river discharge, water level, and ground water level. The dataset available refers to the last three years.
Meteo Browser South Tyrol is a web application based on the statistical programming language R (
Finally, the developed web application provides a fast and comprehensible solution to access, visualize and download openly available databases exposed to a JSON-based API. This can be further developed and possibly expanded to other networks based on similar APIs and Open Data standardization.
Installation
Usage
The tool creates multiple queries that filter and resample the available data (Fig.
Developer Notes
In the aggregation of dates and times the following criteria are used. The hourly time aggregation rounds values up to the nearest integer value ("ceiling" approach). Daily, weekly, monthly, and yearly time aggregations round values down to the nearest integer value ("floor" approach).
This R Package is licensed under the GNU General Public License v3.0
Web location (URIs) and repository
A stable online version is available here: http://meteobrowser.eurac.edu/
The repository is at the following link: https://github.com/GiulioGenova/MeteoBrowser
References
-
How can we improve agriculture, food and nutrition with open data.Global Open Data for Agriculture and Nutrition2015URL: https://www.godan.info/sites/default/files/documents/How%20Can%20We%20Improve%20Agriculture%2C%20Food%20and%20Nutrition%20with%20Open%20Data.pdf
-
shiny: Web application framework for R.1.2.0. URL: https://CRAN.R-project.org/package=shiny
-
leaflet: Create interactive eb maps with the JavaScript 'Leaflet' library.2.0.2. URL: http://rstudio.github.io/leaflet/
-
Benefits, adoption barriers and myths of open data and open government.Information Systems Management29(4):258‑268. https://doi.org/10.1080/10580530.2012.716740
-
R: A language and environment for statistical computing.3.5.1.R Foundation for Statistical Computing. Release date:2018-2-07. URL: https://www.R-project.org/
-
Tidy Data.Journal of Statistical Software59(10). https://doi.org/10.18637/jss.v059.i10
-
devtools: Tools to make developing R packages easier.2.0.1. URL: https://CRAN.R-project.org/package=devtools
-
Innovation with open data: Essential elements of open data ecosystems.Information Polity19:17‑33. https://doi.org/10.3233/IP-140329