|
Research Ideas and Outcomes : Policy Brief
|
|
Corresponding author: Evelyn Underwood (eunderwood@ieep.eu)
Received: 28 Jun 2018 | Published: 02 Jul 2018
© 2018 Evelyn Underwood, Katie Taylor, Graham Tucker
This is an open access article distributed under the terms of the Creative Commons Attribution License (CC BY 4.0), which permits unrestricted use, distribution, and reproduction in any medium, provided the original author and source are credited.
Citation: Underwood E, Taylor K, Tucker G (2018) The use of biodiversity data in spatial planning and impact assessment in Europe. Research Ideas and Outcomes 4: e28045. https://doi.org/10.3897/rio.4.e28045
|
|
Abstract
This review identifies successful approaches to collating and using biodiversity data in spatial planning and impact assessment, the barriers to obtaining and using existing data sources, and the key data gaps that hinder effective implementation. The analysis is a contribution to the EU BON project funded by the European Commission FP7 research programme, which aimed to identify and pilot new approaches to overcome gaps in biodiversity data in conservation policy at European and national levels.
The consideration of biodiversity in impact assessments and spatial planning requires spatially explicit biodiversity data of various types. Where spatial plans take account of biodiversity, there are opportunities through Strategic Environmental Assessment (SEA) of development plans and Environmental Impact Assessment (EIA) of individual development proposals to ensure that consented activities are consistent with no net loss of biodiversity or even a net gain, and help to maintain or develop coherent ecological networks. However, biodiversity components of SEAs and EIAs have often been found to be of insufficient quality due to the lack of data or the inadequate use of existing data.
Key obstacles to providing access to biodiversity data include the need for data standardisation and data quality governance and systems, licensing approaches to increase data access, and lack of resources to target gaps in data coverage and to develop and advertise policy-relevant data products. Existing data platforms differ in the degree to which they successfully provide a service to spatial planners and impact assessment practitioners. Some local governments, for example Somerset County Council in the UK and the Bremen federal state in Germany, have invested in integrated data collection and management systems that now provide intensively used tools for spatial planning and impact assessment informed by local data collection and monitoring.
The EU BON biodiversity data portal aims to provide a platform that is an access point to datasets relevant to essential biodiversity variables on species, habitats and ecosystems. The EU BON taxonomic backbone provides an integrated search function for species and taxa according to different classifications, and also provides a range of tools for data analysis and decision-support. This will increase the accessibility of the vast range of biodiversity data available in different sources and allow the targeting of future data collection to address current gaps.
Keywords
EU BON, spatial planning, marine spatial planning, biodiversity data, environmental impact assessment, strategic impact assessment, EIA, SEA, appropriate assessment, data users, web portal
Key questions and premises
This review identifies successful approaches to collating and using biodiversity data in spatial planning and impact assessment, the barriers to obtaining and using existing data sources, and the key data gaps that hinder effective implementation. It primarily targets the public authorities responsible for assessing the quality of the impact assessments and the integration of any resulting decisions into spatial planning, and the private consultants and public institutes that are providing impact assessments. For example, in the case of environmental impact assessment (EIA), the key primary data users are the consultants hired by private developers to produce EIAs, and the public planning authority responsible for reviewing the EIA and granting planning permission. The key secondary data users are the stakeholders commenting on planning applications including NGOs and private citizens. The access of public planning authorities to biodiversity data varies and the work highlights examples of good practices in data access and use, examples where data have not been used despite availability, and finally cases in which data are not currently available. The research aims to highlight the benefits of integrating biodiversity information at an early stage in development planning, and examples of systematic biodiversity data collection that informs systematic development planning. We identify strategies for data mobilization and use in conservation and show what data gaps could be filled using new tools, additional open access datasets and citizen science initiatives. The analysis is a contribution to the EU BON project funded by the European Commission FP7 research programme, which aimed to identify and pilot new approaches to overcome gaps in biodiversity data in conservation policy at European and national levels.
In this review, spatial planning refers to the public process for analysing and allocating the spatial and temporal distribution of human activities across a landscape or region, including the creation of a spatial plan. Impact assessment (IA) refers to the assessment of impacts on biodiversity associated with development plans, resulting in planning decisions or prioritisations that reduce or minimise impacts on biodiversity. Spatial plans and other development plans that influence certain sectors must undergo a Strategic Environmental Assessment (SEA), which aims to ensure that environmental aspects are considered effectively in plans including the identification of alternatives and mitigation measures related to the siting of major infrastructure. Plans and programmes are also subject to an appropriate assessment (AA)*
Role of spatial planning and impact assessments in biodiversity conservation
Spatial planning can contribute to biodiversity objectives by integrating all the issues that affect the development and use of land within a specific territorial area, as well as considering strategic issues that may affect a wider area than the individual plan, including functional ecological areas. Ideally, plans should set out a clear vision for how the natural environment can be enhanced and how to ensure that social and economic development takes place within environmental limits.
The approach to terrestrial spatial planning varies greatly between and within Member States. Each Member State has its own legal framework and spatial plans at national, regional and local scales. However, only a few regions in the EU currently develop large-scale terrestrial spatial plans that identify desired land uses with respect to environmental, social and economic needs, and not all Member States explicitly address biodiversity in spatial planning (i.e. identifying areas of land in spatial plans with different levels of protection/ biodiversity-friendly management in order to achieve biodiversity objectives). Where there is obligatory biodiversity compensation and offsetting, for example in Germany, spatial planning is an important tool for reserving and optimising biodiversity compensation or offset areas.
Marine spatial planning is only now being established, but presents significant opportunities for large-scale systematic planning for biodiversity conservation. The Maritime Spatial Planning Directive*
The INSPIRE Directive*
Spatial planning provides the spatial framework for Strategic Environmental Assessment (SEA) of development plans and Environmental Impact Assessment (EIA) of individual development proposals. SEAs can promote the integration of biodiversity concerns into spatial plans and land use plans, including identification and safeguarding of areas which are needed to meet local, national or EU biodiversity targets, both to conserve existing biodiversity, and to ensure space is available for compensatory measures. The assessment of potential cumulative impacts on biodiversity is best dealt with at the strategic planning level and at a regional or landscape scale, and therefore SEAs of plans have a major role to play in this respect, while project-level EIAs should consider cumulative impacts to the degree that it is feasible. Where spatial plans take account of biodiversity, there are opportunities through EIA to ensure that consented activities are consistent with no net loss of biodiversity or even a net gain, and help to maintain or develop coherent ecological networks. However, a lack of terrestrial regional planning in many Member States means that many SEA and EIA processes are conducted in the absence of high-level spatial policy and related guidance.
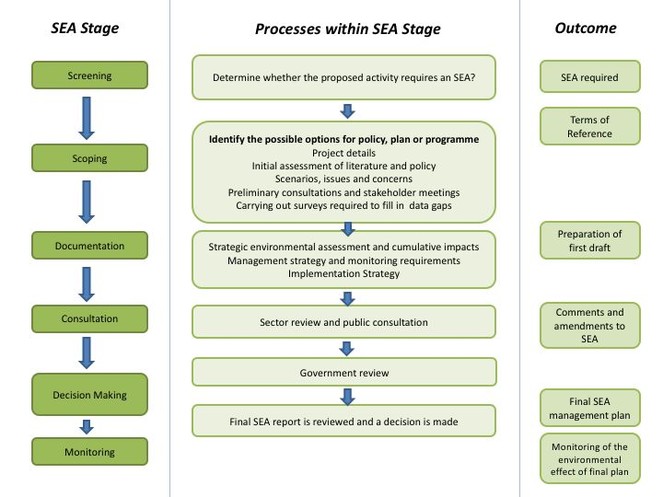
Strategic Environmental Assessment (SEA) considers plans and programmes to find alternatives that locate developments in areas that avoid significant environmental impacts as much as possible, and if necessary to identify sites where compensation or offsetting could provide valuable benefits (see Fig.
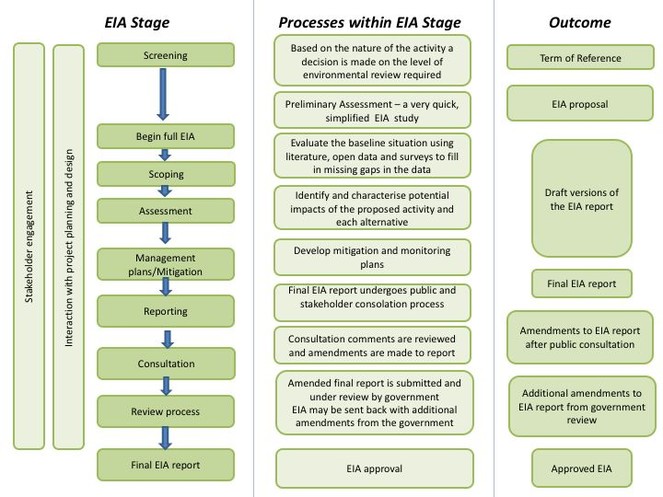
Environmental Impact Assessment (EIA) is a process designed to ensure that projects likely to have significant effects on the environment because of their nature, size or location are subject to an assessment of their environmental effects before development consent is given (see Fig.
Appropriate Assessment (AA) is designed to assess any significant negative impacts of developments on habitat types and species for which Natura 2000 sites are designated. It is mandatory for any plans or projects possibly affecting Natura 2000 sites, and must be separate from EIA or SEA. AA, SEA and EIA have unique but complementary objectives and emphasis in biodiversity impact assessment (see Table
Comparison of main legal and procedural differences between Strategic Environmental Assessment, Environmental Impact Assessment and Appropriate Assessment (compilation based on
|
Procedure |
SEA |
EIA |
AA |
|
Applicability |
assessment of potential impacts of certain plans and programmes on the environment |
assessment of potential impacts of certain projects on the environment and on biodiversity |
assessment of potential impacts of plans and projects on Natura 2000 sites |
|
Scope of applicability |
some mandatory, some via screening, some exempt |
some mandatory, some only above threshold, others via screening |
all plans/projects with potentially significant impacts |
|
Impact on decision making |
informs decision-making on planning (‘take into account’) |
informs decision making on permitting/licensing (‘take into consideration’) |
legally binding decision based on the precautionary principle |
|
Scope of impacts covered by assessment |
potential short/long-term, direct/indirect, synergistic and cumulative effects on a range of environmental factors, including flora, fauna and biodiversity and their interrelationship |
potential short/long-term, direct/indirect effects on a range of environmental receptors and on biodiversity (including flora and fauna) |
potential short/long-term, direct/indirect and in-combination effects on conservation interest, conservation objectives and site integrity of Natura 2000 sites only |
|
Public consultation |
compulsory consultation of authorities likely to be concerned public consultation |
compulsory consultation of authorities and public likely to be concerned |
not obligatory but encouraged ‘if appropriate’ |
Biodiversity information requirements for impact assessments and spatial planning
The consideration of biodiversity in impact assessments and spatial planning requires a range of biodiversity data to address questions about the area covered by the plan or the possible impact zone of the proposed development (
- Which biodiversity assets (species, habitats etc.) are present?
- Where are they?
- What is their conservation importance?
- What is their conservation status, e.g. what are their threat status and/or long-term trend?
- Are there other habitats/features that provide important ecological functions (e.g. food resources and connectivity)?
- What protected areas and other areas of conservation concern are present?
Data useful for biodiversity mapping include land cover maps, habitat and biotype distribution data, species distribution maps, location of protected areas, and other environmental data that directly relate to relevant pressures on biodiversity. Data can be presented as a map, metadata, and/or the raw data as a download. The types of biodiversity data required for spatial planning and impact assessments are listed in Table
Types of biodiversity data that may be required for an Environmental Impact Assessment, Strategic Environmental Assessment, Integrated Assessment or spatial plan.
|
Type of biodiversity data |
Format of data |
Relevance to impact assessment / spatial planning |
|
Species distribution map (sometimes combined with relative abundance) |
GIS maps of actual occurrence and/or modelled distributions: - grid-based data (raster, km2) - polygon data (shapefiles) - average frequency of occurrence within specific geographic units e.g. regions or countries |
Location of species of conservation concern in relation to planned development |
|
Species occurrence records |
Individual occurrence records (point data) Occurrence within a patch (plot, region etc.) Sampling records (occurrence of all species in an area) |
Location of species of conservation concern in relation to planned development |
|
Species abundance |
Numbers of individuals during breeding/ migration/ wintering season at local, regional or national level |
Baseline of species abundance and distribution before development |
|
Species threat status |
Global, regional (eg European) and national Red List status and other national and local conservation status assessments / lists (e.g. in National Biodiversity Action Plans) |
Prioritization of possibly affected species according to threat status |
|
Species abundance trend |
Trend (time series) calculated from repeated sampling-event data |
Baseline of species population trend before development |
|
Species behaviour / trait |
Individual scientific studies and reviews of findings Trait data extracted from data sets e.g. fish catch data May be single observance/experiment or time series |
Possible impact of particular activity on species, cumulative impact of several activities |
|
Habitat and vegetation maps |
Survey data – maps and spatially specific survey findings according to a classification system (e.g. EUNIS) |
Location and identity of habitats within development area providing contextual and baseline information data for species occurrence maps or models |
|
Community composition |
Species richness and/or presence of characteristic species |
Provides baseline data and an indication of conservation value |
|
Ecosystem functions |
Qualitative or quantitative information on soil, air and water functions, eg cold air flows, soil erosion, soil compaction, groundwater flows |
Environmental status of development area |
|
Species genetic composition |
Allelic diversity |
An appropriate assessment should evaluate the conservation status of rare species, which may include their genetic composition, but not required for SEA or EIA. |
Data at the EU-level, national or regional scale are usually utilised during the screening and scoping stages within impact assessments. They are used to help planners ask fundamental questions to decide whether the impact of development will be significantly damaging for biodiversity. Wherever planning or programming and the associated SEA affect more than one country, for example transport or energy infrastructure, or planning in international marine waters or river basins, there is a requirement for data that are comparable across the different countries involved. This creates a need for data centres that provide data sets for a group of countries or at the EU level.
Species occurrence data are available via the Global Biodiversity Information Facility (GBIF), European Ocean Biogeographic Information System (EurOBIS) and national portals. The European Bird Census Council (EBCC) provides European bird data including populations, abundance and trends. In Europe’s marine areas, there are initiatives that bring together data from Member States bordering the sea. For example, Member States bordering areas of the Baltic Sea have collaborated together to develop the Baltic Sea portal HELCOM. Table
Terrestrial biodiversity data sets and related environmental data sets at the EU level (see Suppl. material
|
Dataset |
Type of data |
Spatial coverage |
Data format and resolution |
Accessibility |
Relevance to EIA, SEA or Spatial Planning |
References and sources |
|
Conservation status of habitats and species of EU community interest (Article 17 dataset) |
Member State assessments of the status (according to agreed categories) of most habitats & species of Community Interest in each biogeographical region within their country |
All Member States except Greece |
Status assessments within biogeographic regions in each Member State; national data vary with some having individual site level data |
EEA/Biodiversity Topic Centre dataset available under European public access rules; national data accessibility varies, e.g. UK site data available online |
Spatial Planning. SEA |
|
|
Natura 2000 site standard data form dataset |
Location of Natura 2000 sites; presence, condition and conservation value of qualifying habitats and species of EU community interest within Natura 2000 sites (condition = A excellent conservation or B good conservation or C average or reduced conservation) |
All Member States |
Natura 2000 site scale data; no information on accuracy of assessments and these vary greatly between Member States and sites; only a proportion of assessments are annually updated - some sites have only been assessed once on designation; no standardisation of condition categories and methods of assessment |
EEA/Biodiversity Topic Centre dataset available under European public access rules; extent and availability of national condition monitoring and data varies greatly |
Spatial planning |
|
|
IUCN Red List status |
Expert assessments of species extinction probability at global, EU and European level and maps of species range |
EU and Europe |
Species assessments at global, European & EU level Polygon range maps |
Online database of expert summaries for non-commercial purposes subject to IUCN conditions of use; range maps can be downloaded by registered experts |
SEA and Spatial Planning (must be supplemented with local data) |
|
|
Pan-European Bird Monitoring Scheme data |
Annual bird population trends from a range of survey designs, summarizable to larger common spatial scales. |
Many MS |
Variable, aggregated data at NUTS3 scale likely |
Negotiation required to access data under agreement; access to aggregated data (e.g. NUTS3 scale) likely |
EIA, SEA and Spatial Planning |
EBCC 2014 |
|
European Breeding Bird Atlas 1 and 2 |
European distribution of all breeding bird species (1997 and 2017) |
All MS |
50 km scale comprehensive coverage |
EBCC1 publicly accessible with acknowledgement: EBCC2 pilot maps available on request with acknowledgement |
EIA, SEA and Spatial Planning |
|
|
GBIF |
Occurrence records for nearly a million species |
Data are heavily skewed to a few countries who upload the majority of the records. |
Correct species name (according to Catalogue of Life), date, location, basis of record (e.g. human observation, remote sensing data), source dataset |
Access to source dataset subject to agreement with GBIF conditions, and note of any issues with the data (e.g. inaccurate location) |
EIA, SEA and Spatial Planning - subject to data limitations |
|
|
Corine Land Cover |
Remote-sensed land-use - GIS and Excel databases with spatial and quantitative data on area and distribution of 44 Corine land cover types |
EU-28 & Europe |
25 ha pixels, amalgamated into contiguous land-use polygons; five main land cover types available at 20 m resolution |
Accessible online under European public access rules; restrictions to data accessibility for UK and Greece. Complete dataset from 2006, partial dataset from 2012. |
EIA, SEA and Spatial Planning |
|
|
Butterfly Conservation Europe data |
Annual data on butterfly numbers from various national surveys, summarizable to larger common spatial scales. |
Six MS |
Variable, common summaries at NUTS3 scale likely |
Negotiation required to access data under agreement for a specific purpose; access to summary data (e.g. NUTS3 scale) possible |
EIA |
|
|
LepiDiv Projekt – European Butterflies |
European range of butterfly species |
All MS |
Polygon shape files of European range |
Available from project coordinators under agreement for a specific purpose |
EIA |
|
|
LUCAS survey on Eurostat |
Periodic surveys of land cover and land use: 1) systematic sample of land cover points; 2) stratified sample of field characteristics measured in field visits. |
EU |
phase 1) points spaced 2 km apart in the four cardinal directions covering the whole of the EU’s territory; phase 2) sample selected independently in each NUTS level 2 region |
Negotiation required for access to summarized data (landscape parcel scales) |
EIA |
http://ec.europa.eu/eurostat/statistics-explained/index.php/LUCAS_-_Land_use_and_land_cover_survey |
Marine biodiversity data sets and related environmental data sets at the EU level. (see Suppl. material
|
Dataset |
Type of data |
Spatial coverage |
Data format and resolution |
Accessibility |
Relevance to EIA, SEA or Spatial Planning |
References and sources |
|
Bird distribution |
Species distribution |
Europe |
Report and atlas |
On request subject to restrictions |
EIA, SEA and spatial planning |
|
|
EMODnet / EurOBIS species records |
Species occurrence (phytoplankton, zooplankton, angiosperms, macro-algae, invertebrate bottom fauna, birds, mammals, reptiles and fish). |
All European regional seas |
Distribution grid maps and point data; downloads in various formats. Spatial resolution varies. |
Open access bound by EMODnet terms and conditions; data are accessable via the EMODnet and LIFEWATCH websites. |
SEA and spatial planning |
http://www.emodnet-biology.eu/toolbox/en/download/occurrence/explore |
|
IUCN Red List of threatened marine fish species |
Species threat status and occurrence |
European regional seas |
Grid-data at 10 km x 10 km scale |
Online database of expert summaries for non-commercial purposes subject to IUCN conditions of use; range maps can be downloaded by registered experts. |
SEA and spatial planning (supplemented with local data) |
|
|
EMODnet Seabed Habitats (EUSeaMap 2016) |
Habitat distribution (using the EUNIS and Marine Strategic Framework Directive predominant habitat classifications) |
European regional seas |
Predictive seabed habitat map with associated confidence maps (high, medium, low). |
Access for non-commercial use bound by EMODnet terms and conditions; downloadable as ESRI Shapefiles |
Spatial planning |
|
|
OSPAR Threatened and/or Declining Habitats 2015 |
Habitat distribution (according to the OSPAR classification) |
Northeast Atlantic |
Compilation of OSPAR habitat data |
Access for non-commercial use from EMODnet bound by terms and conditions; downloadable as ESRI Shapefiles |
Spatial planning |
|
|
ICES fish stocks datasets |
Species distribution (fish including sharks and rays) |
Europe |
Data layers within the ICES portal and AquaMaps |
Access online or via data request form according to ICES data policy. |
EIA, SEA and spatial planning |
|
|
ICES / HELCOM seabird datasets |
Species distribution and abundance, biologuy (brain, eggs, feathers, fat, liver, kidney, muscle) (selected seabirds) |
Northeast Atlantic |
Data sets in different formats (survey data, community data or sample measurements) |
Downloadable as maps, charts and tables subject to specific exclusions to unrestricted public access, as data may have been provided by non-governmental organisations. |
EIA, SEA |
|
|
HELCOM/ ASCOBANS Harbour Porpoise data |
bycatch, effort sightings, hunted or killed, incidental sightings and strandings |
Baltic and North Seas |
Database |
Access for non-commercial purposes bound by terms and conditions |
EIA, SEA |
http://helcom.fi/baltic-sea-trends/data-maps/biodiversity/harbour-porpoise |
Some Member States have developed national portals to aid policy makers and consultants with spatial planning, EIA and SEA. For example, the Danish Natural Environment Portal and the UK MAGIC portal provide access to large collections of data sets on biodiversity and the environment (see Suppl. material
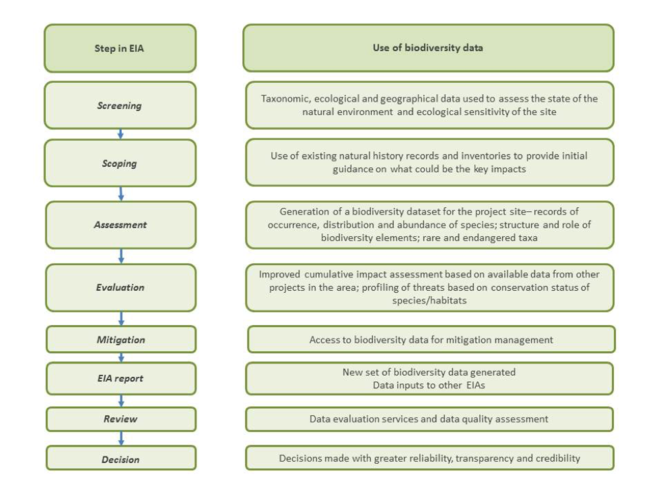
The EIA process assembles a biodiversity dataset for a specific project site. Different kinds of data are used at each step in the EIA process, as illustrated in Fig.
Challenges to accessing biodiversity data for spatial planning and impact assessments
The processes of spatial planning, SEA and EIA are closely connected and are designed to inform one another. Spatial plans can provide a holistic approach addressing social, economic, and environmental objectives to help to achieve sustainable development. If the best available information is used, spatial plans can reduce conflicts between industrial sectors and the environment and can also reduce the risk of development activities damaging ecosystems through an improvement in the consideration of cumulative effects. The spatial planning process allows for more informed and rational selection of development sites and for more efficient use of space and resources (
However, spatial plans based on poor and limited biodiversity data will hinder the scope of SEAs and EIAs, and can lead to reduced or aborted projects with potentially major economic impacts on developers. An example of this, as documented in the evaluation study supporting the Fitness Check of the birds and habitats directives (
SEAs and EIAs are often found to be of insufficient quality because of the limited access to environmental data, including biodiversity data, and/or inadequate use of existing data (
The lack of biodiversity data may result in weaker protection and poorer quality of mitigation than could otherwise be achieved. A review of ecological impact assessments in England from the year 2000 found that although the EIAs often resulted in the implementation of habitat mitigation measures, these were often based on a weak information base and consequently had a low effectiveness (
A study in Finland (
Appropriate assessments for developments in Natura 2000 sites require an additional depth of information on the habitats and species of European conservation concern present in the site. A review of EIA and AA of port development projects in European estuaries (
The INSPIRE Directive has instigated efforts to coordinate and increase public access to spatial data and coordinate data use across governments, and a number of national and regional geo-portals now provide public access (under different types of license agreements) to many datasets and services that go beyond INSPIRE requirements (
However, INSPIRE has not yet brought about widespread benefits for the sharing and interoperability of biodiversity data, as the deadline for application of INSPIRE directive standards and requirements to existing datasets on species distributions and habitats and biotopes is in 2020. A 2014 survey of INSPIRE implementation (
If all the data that quantifies the habitats and species present in a defined local area is collated and available in a GIS system (and regularly updated), it can be used by local planning authorities to inform spatial planning (
The Shetland Islands’ Marine Spatial Plan (SMSP) (
It is becoming increasingly feasible in terrestrial areas to use remote sensing data for the monitoring of the Natura 2000 network and to inform of developments that might require appropriate assessment (
The European CORINE land cover classification system is currently not suitable for measuring semi-natural habitats of conservation value. The European Environmental Information and Observation Network (EIONET) expert Group on Land Monitoring in Europe (EAGLE) has developed enhanced class definitions for the CORINE land cover classification, which should provide a more consistent harmonized CLC map production (both with traditional photo-interpretation and bottom-up/semi-automated methods), and a way to break down land cover class description to land cover, land use and characteristic landscape components (
Challenges to stakeholders accessing biodiversity data generated by impact assessments
Biodiversity information obtained during EIAs is rarely accessible for other uses following the completion of the EIA. Reasons include the fact that the primary biodiversity data collected during EIAs are typically gathered as a ‘one off’ and vary greatly in precision, accuracy and type; the data are rarely captured in forms and formats that make them accessible and re-usable, and so are inaccessible after the completion of the EIA (
Respondents to a survey of organisations involved in wetland conservation in the Mediterranean region in 2011 (
The UK government has committed to enabling open access to as much marine data as possible*
Problems with access to government-held data on habitats and species distributions occur in some Eastern European countries. In Bulgaria, government data on habitat and species distribution and monitoring is not made available by the Ministry of Environment. The Bulgarian Biodiversity Foundation (BBF) has therefore developed a web-based GIS platform that provides public access to spatial plans, with locations of protected areas (including Natura 2000) and other information on species and habitats in Bulgaria*
Sustainable solutions to the co-existence of resource exploiting activities with nature conservation are often only possible when the best possible data are available to all stakeholders involved and a consensus can be reached. For example, in the Welsh part of the Irish Sea, a method was developed for assessing the sensitivity of different seabed habitats to existing fishing activities, across a range of potential fishing intensities (
An EIA biodiversity data publishing framework, based on the Global Biodiversity Information Facility (GBIF) global standards, has been proposed to make EIA biodiversity data available and exchangeable using globally accepted standards (
Challenges in developing relevant and useful data platforms
Numerous platforms at the EU level and in Member States offer access to biodiversity data and information relevant to spatial planning and impact assessment. The policy requirement for maritime spatial planning has stimulated the development of GIS systems that integrate environmental and biodiversity data on marine and coastal habitats and ecosystems (
Data portals differ greatly in the scope and content of the biodiversity data they provide, but also in the degree to which they successfully provide a service to spatial planners and impact assessment practitioners. The Suppl. material
Standardising data and data quality controls
Biodiversity portals aim to source data from a variety of sources including conservation organisations, scientific research bodies and some data from citizen science projects. Standardizing the data, such as in relation to species nomenclature, is a challenge for portal developers. The EMODnet portal has addressed the challenge of managing marine biodiversity data by investing in the development of a global taxonomic standard (World Register of Marine Species) and by using the IOC-OBIS community to discuss and define standards in biodiversity management. The marine data and metadata on the portal conform to the INSPIRE Directive requirements and to the standards set by the SeaDataNet, WoRMS, OBIS (Ocean Biogeographic Information System), GBIF and LifeWatch systems. These data are applicable mainly to species at the moment, with less relevance for habitats (although the classification systems for habitats in Europe are better established than those available globally).
All the portals produce guidelines on how data should be presented and data quality requirements. Data quality control systems with regular data checks and updates are required as some incoming data will still have errors. Data quality control is dependent on the degree of interest at national level, the resources available to institutions involved in data collection and their desire to ensure high-quality collection and management approaches, and the systems through which civil society and the public sector contribute data. A review of biodiversity data providers within the Mediterranean region (
Updating data
Having consistent time frames across available data is very important. Without this, it is very difficult to assess change over time, to develop natural capital accounts, and/or to see whether the species/habitat of conservation importance occur within the area of interest. Recommended practice is to establish a suitable length of time for future updates, but identifying and implementing appropriate time cycles for updating data to suit the demands and needs of different use cases can be challenging. Different datasets will vary in terms of the time period after which they are deemed to be out of date, but resource availability issues are a limitation to maintaining a suitable updating regime. There are also issues when collating information, particularly when that information is updated regularly by the data owner - how do you ensure the data hosted in the local GIS system are regularly updated to match the data owner's version?
Gaps in data coverage
All the EU and national biodiversity data portals have spatial and temporal gaps in coverage, due to a combination of reasons including lack of information, lack of access to available datasets, and lack of data sharing arrangements. For example, the UK holds one of the most comprehensive sets of habitat and species information. The UK government MAGIC data platform holds a large number of datasets of which over half are available under open access. However, other data may require specific licences to be published and shared, preventing the upload of the entirety of the data held by portal developers. If data do not meet the portal requirements they will not be uploaded, which may lead to gaps in data coverage*
Greater availability and synchronisation of information on the data types held by each portal is needed to prevent replication of data across portals and to provide target audiences with accurate information on the vast range of open data accessible at both national and EU level. For example, the EMODnet portal has limited data coverage of the Mediterranean Sea, particularly benthic data*
The European Commission carried out a public consultation on the EMODnet and GMES data platforms (
Different scale thresholds
The scale at which data are provided to the portals is not always at the threshold required for sufficiently detailed evaluations of species and habitats in a particular area, as reported as a concern by users of the EMODnet and MAGIC platforms*
Identity and requirements of end-users
Data portals and information systems have the potential to facilitate the work of a diverse set of stakeholders, including spatial planners, environmental consultants, NGOs and decision-makers, as well as land owners, estate agents and local authorities. Several of the portals reviewed in this study undertake regular surveys to establish the identities of their users and their data needs. Detailed information is available in the Suppl. material
The identity of portal users varies across portals. In the case of the Danish Nature Portal, the top users were identified as staff from the municipalities, regional and national government, and consultants employed by government*
Understanding the identities of portal users could allow the development of task suites or service views which are designed specifially for different use cases, such as spatial planning or policy. This would improve the accessibility of portals and increase user engagement.
Portal design
To encourage wider usage, portal design must allow the user to easily identify and access the data they require for their needs, and then quickly browse all the additional ‘nice to have’ data, as recommended by a plan for a Baltic Sea data exchange structure (
Data analysis and interpretation to inform decision making
Influencing biodiversity policy making requires the timely communication of biodiversity results and analysis at national and local levels. In the majority of portals reviewed in this study, the available data are not easily interpretable by non-expert audiences, and require further interpretation with other contextual information in order to provide policy-relevant information.
An appropriate governance structure is needed to decide what data should be collected and how they should be assembled, and the process must be administered, e.g. through the work of a secretariat. For example, a review of monitoring for the Marine Strategic Framework Directive concluded that using the same datasets for different indicators and descriptors would increase efficiency, and coordinated investments in new monitoring approaches (such as remote sensing, underwater video survey and Continuous Plankton Recorders) would fill data gaps (
In the German federal state of Bremen, biodiversity monitoring has been carried out since 2004 in an integrated programme which sets uniform standards and guidelines for sampling and monitoring. The data are combined in a single GIS managed by a private company created for the purpose with financing and supervision by the Bremen nature authority (
Publicity and engagement
The Mediterranean Biodiversity Protection Platform (to be launched in 2018) is actively involving a range of partners to ensure efficient networking, communication and provision of data, including representatives of suitable technical, institutional and financial organisations*
One approach to dissemination and outreach is that of the MAGIC platform (UK), which utilises online social networks such as LinkedIn to promote the platform, and demonstrate the services offered to prospective users such as environmental consultants, in terms of planning and developing EIA, SEA and appropriate assessments*
Conclusions and recommendations
The effective use of biodiversity data to inform spatial planning and environmental impact assessment depends upon the availability of relevant, accurate and geographically appropriate data. In many cases, such data are lacking, which restricts the quality of decision-making. Ideally, the development of spatial plans should include a data-gathering component, and mapping efforts should focus on identifying biological elements of particular ecological significance.
The consideration of biodiversity in impact assessments and spatial planning requires spatially explicit biodiversity data of various types. Where spatial plans take account of biodiversity, there are opportunities through Strategic Environmental Assessment (SEA) of development plans and Environmental Impact Assessment (EIA) of individual development proposals to ensure that consented activities are consistent with no net loss of biodiversity or even a net gain, and help to maintain or develop coherent ecological networks. However, biodiversity components of SEAs and EIAs have often been found to be of insufficient quality due to the lack of data or the inadequate use of existing data. The INSPIRE directive has not yet increased the sharing and interoperability of biodiversity data and most biodiversity data sources are not yet INSPIRE compliant.
Numerous platforms at the EU level and in Member States offer access to biodiversity data and information relevant to spatial planning and impact assessment, but differ in the degree to which they successfully provide a service to spatial planners and impact assessment practitioners. Key obstacles include the need for data standardisation and data quality governance and systems, and lack of resources to target gaps in data coverage, and to develop and advertise policy-relevant data products. Some local governments, for example Somerset County Council in the UK and the Bremen federal state in Germany, have invested in integrated data collection and management systems that now provide intensively used tools for spatial planning and impact assessment informed by local data collection and monitoring.
The EU BON biodiversity data portal aims to provide a platform that is an access point to datasets relevant to essential biodiversity variables on species, habitats and ecosystems. The EU BON taxonomic backbone provides an integrated search function for species and taxa classified according to different pan-European species directories, including Euro+Med Plantbase, Fauna Europaea, European Register of Marine Species (ERMS), Index Fungorum, the Catalogue of Life (CoL), the World Register of Marine Species (WoRMS), the GBIF Checklist Bank and the Plazi TreatmentBank. The backbone maps these against the European species and habitats database EUNIS. The portal also provides a range of tools for data analysis and decision-support. This will increase the accessibility of the vast range of biodiversity data available in different sources and allow the targeting of future data collection to address current gaps.
Identifying and collating all the data available at national and European level could benefit policy implementers and practitioners by reducing the time and effort needed to source data from fragmented sources. The portal development process should seek to involve key stakeholders, to ensure that it satisfies their requirements, focussing on priority areas for biodiversity data based on the recommendations from stakeholders involved in biodiversity conservation and management. Communication will be fundamental for coordination between the various national data holders. In addition, routes to improving data availability and collation could be identified through actions such as the organisation of an annual meeting to bring together experts from across the Member States. Developing EU guidelines for the provision of data and its upkeep would facilitate interoperability. A key factor in the success of data portals is ensuring adequate publicity of its capabilities.
The availability of funding is a key limiting factor to biodiversity monitoring and data mobilisation. The future of biodiversity data collection may depend increasingly on citizen science if funding cuts to research institutions continue. Data collected by citizen scientists can be used for biodiversity monitoring and indicators if there is a clear direction as to what data are required, to prevent the generation of large volumes of data with little structure and representation (
Restrictions to availability and interoperability of data are a barrier to expansion of data platforms, as obtaining data that are owned by different institutions is challenging. Although open access is the preferred approach, options such as licences and permits for specific data uses can persuade data owners to share data where they have concerns about their lack of control over the uses to which the data are put.
Improved access to spatially explicit biodiversity data in the EU can help to:
- avoid detrimental impacts on the most important sites and species and habitats;
- target conservation actions and thereby increase their efficiency;
- harmonize biodiversity monitoring and evaluation frameworks which link policy, impacts and results;
- publish indicators of status and trends of biodiversity and the expected impacts of pressures;
- facilitate the public availability of biodiversity data and studies currently kept within the private sector, NGOs, universities etc.
Acknowledgements
The following interviews were carried out:
Danish Natural Environment Portal – interview with Nils Høgsted, portal manager, 28 January 2016
EMODnet – interview with Simon Claus, EMODnet, 3 February 2016
SeaGIS – interview with Johnny Berglund, SeaGIS project manager, County Administrative Board of Västerbotten, 15 April 2016
MAGIC platform – interview with Andrea Ryder, Natural England, 8 March 2016
Bulgarian Biodiversity Foundation (BBF) – interview with Peter Todorov, BBF, 12 February 2016
Lauren Weatherdon of UNEP-WCMC kindly reviewed the final manuscript and provided useful comments.
Funding program
This paper was supported by the EU BON project which is a European Union’s Seventh Framework Programme for Research and Technical Development under grant agreement No 308454.
Grant title
EU BON - Building the European Biodiversity Observation Network
Hosting institution
Institute for European Environmental Policy (IEEP)
References
-
A review of access to industry marine environmental data.A report produced by ABP Marine Environmental Research Ltd for Productive Seas Evidence Group,UK. URL: http://www.gov.scot/Resource/0049/00490558.pdf
-
Birds in the European Union: a Status Assessment.Birdlife International,Wageningen, Netherlands. URL: http://www.birdlife.org/action/science/species/birds_in_europe/birds_in%20_the_eu.pdf
-
Recommendations on how Copernicus (GMES) can contribute to Biodiversity (BD) policies.BIO_SOS Biodiversity Multisource Monitoring System: from Space TO Species,http://www.biosos.eu/. URL: http://www.biosos.eu/deliverables/D8-9.pdf
-
Study concerning the report on the application and effectiveness of the EIA Directive.COWI A/S,Denmark. URL: http://ec.europa.eu/environment/archives/eia/pdf/eia_study_june_09.pdf
-
The use of spatial data for the preparation of environmental reports in Europe.Joint Research Centre Institute for Environment and Sustainability,Ispra, Italy. URL: http://ec.europa.eu/environment/eia/pdf/jrc_technical%20report_2009%20eia-sea%20survey.pdf
-
Ecological mitigation measures in English Environmental Impact Assessment.Journal of Environmental Management119:103‑110. https://doi.org/10.1016/j.jenvman.2012.12.050
-
Midterm evaluation report on INSPIRE implementation.European Environment Agency & European Union,Luxembourg: Publications Office of the European Union. URL: http://www.eea.europa.eu/publications/midterm-evaluation-report-on-inspire-implementation
-
State of Europe's Seas.European Environment Agency,Copenhagen. URL: http://www.eea.europa.eu/publications/state-of-europes-seas
-
Natura 2000 data - the European network of protected sites.European Environment Agency,https://www.eea.europa.eu/data-and-maps/data/natura-8. URL: https://www.eea.europa.eu/data-and-maps/data/natura-8
-
Assessing the sensitivity of habitats to fishing: from seabed maps to sensitivity maps.Journal of Fish Biology83(4):826‑846. https://doi.org/10.1111/jfb.12132
-
Article 17 web tool on biogeographical assessments of conservation status of species and habitats under Article 17 of the Habitats Directive.European Topic Centre on Biodiversity,http://bd.eionet.europa.eu/article17/reports2012/. URL: http://bd.eionet.europa.eu/article17/reports2012/
-
Marine Knowledge 2020: from seabed mapping to ocean forecasting - Outcome of Public Consultation.European Commission,Brussels. URL: http://ec.europa.eu/dgs/maritimeaffairs_fisheries/consultations/marine-knowledge-2020/outcome_en.pdf
-
Guidance on Integrating Climate Change and Biodiversity into Environmental Impact Assessment.European Commission,Brussels. URL: http://ec.europa.eu/environment/eia/pdf/EIA%20Guidance.pdf
-
Swedish LifeWatch - A biodiversity infrastructure intergrating and reusing data from citizen science, monitoring and research.Human Computation1(2): . https://doi.org/10.15346/hc.v1i2.6
-
Promoting biodiversity data inclusive EIA: Best Practice Guide for publishing primary biodiversity data.Global Biodiversity Information Facility,Copenhagen. URL: http://links.gbif.org/eia_biodiversity_data_publishing_guide_en_v1
-
Key elements and steps in the process of developing ecosystem-based marine spatial planning.Marine Policy32(5): . https://doi.org/10.1016/j.marpol.2008.03.022
-
Integrated biodiversity impact assessment, streamlining AA, SEA and EIA processes, best practice guidance.Environmental Protection Agency,Ireland. URL: http://www.epa.ie/pubs/reports/research/biodiversity/IBIA_ExecutiveSummary_23April2012.pdf
-
Good Practices for the Collection of Biodiversity Baseline Data.The Multilateral Financing Institutions Biodiversity Working Group & Cross-Sector Biodiversity Initiative,USA. URL: http://www.csbi.org.uk/wp-content/uploads/2015/07/Biodiversity_Baseline_JULY_4a-2.pdf
-
The EBCC Atlas of European Breeding Birds: their distribution and abundance. Interactive Version.T & A.D. Poyser, London, and online version,http://s1.sovon.nl/ebcc/eoa/. URL: http://www.ebcc.info/atlas.html
-
Das Integrierte Erfassungsprogramm Bremen - Ansätze zur Bündelung und Optimierung von Kartierungen für den Naturschutz.Bundesamt für Naturschutz (BfN),Bonn - Bad Godesberg,12pp. URL: http://oekologische-gutachten-handke.de/wp-content/uploads/2017/07/Veroeffentlichung3.pdf
-
BALSAM Project 2013‐2015: Possibilities for synergies in Baltic marine environmental monitoring and recommendations to improve data accessibility, coherence and compatibility to enhance capacity to carry out regional assessments.ICES, HELCOM Secretariat, SMHI, SYKE and IMWG,Helsinki. URL: http://www.helcom.fi/BALSAM%20publications/Baltic%20marine%20monitoring,%20data%20management%20and%20infrastructure.pdf
-
The IUCN Red List of Threatened Species: Europe. Version 2015.3.IUCN - International Union for Conservation of Nature and Natural Resources,http://www.iucnredlist.org/initiatives/europe. https://doi.org/10.2305/IUCN.UK.2017-3.RLTS.T88271043A88271070.en
-
Overview of the situation of biodiversity data and information in the Mediterranean region.IUCNURL: http://planbleu.org/sites/default/files/upload/files/IUCN_Med_Diagnosis_biodiv_data_Med_region_May2015_lr.pdf
-
Guidelines for Appropriate Uses of IUCN Red List Data.IUCN,Gland, Switzerland. URL: http://www.iucnredlist.org/technical-documents/red-list-documents
-
Improving access to biodiversity data for, and from, EIAs – a data publishing framework built to global standards.Impact Assessment and Project Appraisal30(3): . https://doi.org/10.1080/14615517.2012.705068
-
EIA, SEA and AA, present position. Where are we now?Journal of Planning & Environmental Law12:1515‑1532. URL: http://www.ftb.eu.com/articles/eia--sea-and-aa--present-position.pdf
-
Guidance on Integrating Climate Change and Biodiversity into Strategic Environmental Assessment.Report to the European Commission DG Environment,Brussels. URL: http://ec.europa.eu/environment/eia/pdf/SEA%20Guidance.pdf
-
Integrated maritime policy for the European Union - consolidating coastal and marine information to support maritime spatial planning.Journal of Coastal Conservation14(1):11852‑009. https://doi.org/10.1007/s11852-009-0077-4
-
Evaluation Study to support the Fitness Check of the Birds and Habitats Directives.Milieu Ltd, Institute for European Environmental Policy and the ICF International,Brussels. URL: http://ec.europa.eu/environment/nature/legislation/fitness_check/docs/study_evaluation_support_fitness_check_nature_directives.pdf
-
Mediterranean wetlands monitoring situation and needs assessment.Mediterranean Wetlands Observatory,Tour de Valat. URL: http://www.ramsar.org/sites/default/files/documents/pdf/Wetlands_MEsurvey2011.pdf
-
Ecological capacity and competence in English planning authorities - What is needed to deliver statutory obligations for biodiversity?Report published by the Association of Local Government Ecologists (ALGE),UK. URL: http://www.cieem.net/data/files/Resource_Library/News/ALGE_Report_on_Ecological_Competence_and_Capacity.pdf
-
Biodiversity auditing.Houses of Parliament Parliamentary Office of Science & Technology,UK. URL: http://researchbriefings.parliament.uk/ResearchBriefing/Summary/POST-PN-490
-
Environmental Impact Assessment (EIA) and Appropriate Assessment (AA) - Evaluation of assessment tools and methods Lot 2 Analysis of case studies of port development projects in European estuaries.TIDE Tidal River Development ProjectURL: http://www.tide-toolbox.eu/pdf/reports/EAS_Lot2.pdf
-
Environmental Impact Assessment (EIA) and Appropriate Assessment (AA) - Evaluation of assessment tools and methods Lot 1 Legal and procedural aspects of the EU Directives.TIDE Tidal River Development ProjectURL: http://www.tide-toolbox.eu/pdf/reports/EAS_Lot1.pdf
-
Contribution of Copernicus in support to monitoring of habitats, species and the Natura 2000 network.ETC/BD report to the European Environment Agency,Paris. URL: https://bd.eionet.europa.eu/Reports/ETCBDTechnicalWorkingpapers/Copernicus_hab_sp_and_N2K_network
-
Regional marine spatial planning–The data collection and mapping process.Marine Policy50:1‑9. https://doi.org/10.1016/j.marpol.2014.05.012
-
Biodiversity in strategic environmental assessment (SEA) of municipal spatial plans in Finland.Impact Assessment and Project Appraisal28(2): . https://doi.org/10.3152/146155110X498834
-
Somerset County Council Biodiversity Offsetting Complementary Project 2012 – 2014.Draft report to DEFRA
-
Somerset Environmental Records Centre (SERC).2016.Somerset Wildlife Trust,http://www.somerc.com/homepage/. URL: http://www.somerc.com/homepage/
-
Study on Evaluating and Improving the Article 6.3 Permit Procedure for Natura 2000 Sites.Ecosystems Ltd,Brussels. URL: http://ec.europa.eu/environment/nature/natura2000/management/docs/AA_final_analysis.pdf
-
Contribution of a European spatial data infrastructure to the effectiveness of EIA and SEA studies.Environmental Impact Assessment Review25https://doi.org/10.1016/j.eiar.2004.06.011
-
Data exchange structure for Maritime Spatial Planning.Baltic Sea Region Programme 2007-2013,Hamburg. URL: http://www.baltseaplan.eu/index.php/Reports-and-Publications
-
Monitoring for the Marine Strategy Framework Directive: requirements and options.Publications Office of the European Union,Luxembourg. URL: http://publications.jrc.ec.europa.eu/repository/bitstream/JRC68179/lbna25187enn.pdf
Supplementary material
Biodiversity data sources at the EU level comprise the biodiversity and landuse-related EU reporting and monitoring programmes, and global or regional data portals which include data from European countries. Also gives an overview of spatial planning and data sources for biodiversity impact assessment in a selection of EU Member States: UK, Bulgaria, Netherlands, Germany, Sweden, Denmark and the Baltic Sea.
Download file (5.74 MB)
The EU Habitats Directive (Council Directive 92/43/EEC) Article 6(3) requires plans or projects which are likely to have a significant effect on a Natura 2000 site to undergo an ‘appropriate assessment’ (AA) and should be approved only after it is ascertained that they will not adversely affect the integrity of the site concerned. Article 6(4) includes provisions that allow projects or plans that may have adverse impacts to go ahead if they are of overriding public interest and there are no alternative solutions. In such cases the Member State ‘shall take all compensatory measures necessary to ensure that the overall coherence of the Natura 2000 Network is protected’.
Article 3(2) (b) of the EU SEA Directive (Directive 2001/42/EC) states that ‘plans and programmes which, in view of the likely effect on sites, have been determined to require an assessment pursuant to Article 6 or 7 of [the Habitats Directive]’ are subject to compulsory SEA.
For example, England is an exception, as the Marine Management Organisation (MMO) has been delegated responsibility for all coastal and maritime planning.
Belgium, Finland, Hungary and France
Including large power stations, refineries, oil/gas and groundwater extraction, metal, chemical and pulp/paper factories, waste disposal and wastewater treatment plants, quarries and mines, long distance transport infrastructures, pipelines and dams, and large animal rearing installations
In agriculture, silviculture, aquaculture, industry (metals, minerals, energy, chemicals, food, textiles & biomass, etc.), infrastructure, and certain other industrial, urban and rural developments
Member States are therefore in the process of updating their EIA regulations and guidance. They have to amend their national and regional legislation in order to comply with the new rules by 16 May 2017 at the latest.
Article 3.1(b) in Directive 2014/52/EU.
It is important to note that not all Habitats Directive Annex I habitat types are detectable using remote observation imagery, and a certain amount of ground truthing is required for all habitats.
Light Detection and Ranging (LIDAR) is an airborne mapping technique, which uses a laser to measure the distance between the aircraft and the ground, allowing highly detailed terrain models to be generated at spatial resolutions of between 25cm and 2 metres.
Through the Marine Science Coordination Committee (MSCC), a partnership of government departments, devolved administrations of Scotland, Northern Ireland and Wales, environment agencies and research bodies involved in funding and providing marine science in the UK
available on the Marine Data Exchange web platform
i.e. the Marine Environmental Data and Information Network (MEDIN) and Data Archive Centre (DAC)
Personal communication, Andrea Ryder, Natural England, 8 February 2016
Personal communication, Andrea Ryder, Natural England, 8 March 2016
Personal communication, Simon Claus, EMODnet, 3 February 2016
See KOMPANACEA
Personal communication, Lauren Weatherdon, UNEP-WCMC, 31 March 2018