|
Research Ideas and Outcomes : Research Article
|
|
Corresponding author: Lilliana Sancho-Chavarria (lsancho@itcr.ac.cr), Fabian Beck (fabian.beck@wiwinf.uni-due.de), Daniel Weiskopf (daniel.weiskopf@visus.uni-stuttgart.de), Erick Mata-Montero (emata@itcr.ac.cr)
Received: 12 Apr 2018 | Published: 12 Apr 2018
© 2018 Lilliana Sancho-Chavarria, Fabian Beck, Daniel Weiskopf, Erick Mata-Montero
This is an open access article distributed under the terms of the Creative Commons Attribution License (CC BY 4.0), which permits unrestricted use, distribution, and reproduction in any medium, provided the original author and source are credited.
Citation: Sancho-Chavarria L, Beck F, Weiskopf D, Mata-Montero E (2018) Task-based assessment of visualization tools for the comparison of biological taxonomies. Research Ideas and Outcomes 4: e25742. https://doi.org/10.3897/rio.4.e25742
|
|
Abstract
Maintenance and curation of large-sized biological taxonomies are complex and laborious activities. Information visualization systems use interactive visual interfaces to facilitate analytical reasoning on complex information. Several approaches such as treemaps, indented lists, cone trees, radial trees, and many others have been used to visualize and analyze a single taxonomy. In addition, methods such as edge drawing, animation, and matrix representations have been used for comparing trees. Visualizing similarities and differences between two or more large taxonomies is harder than the visualization of a single taxonomy. On one hand, less space is available on the screen to display each tree; on the other hand, differences should be highlighted. The comparison of two alternative taxonomies and the analysis of a taxonomy as it evolves over time provide fundamental information to taxonomists and global initiatives that promote standardization and integration of taxonomic databases to better document biodiversity and support its conservation. In this work we assess how ten user visualization tasks for the curation of biological taxonomies are supported by several visualization tools. Tasks include the identification of conditions such as congruent taxa, splits, merges, and new species added to a taxonomy. We consider tools that have gone beyond the prototype stage, that have been described in peer-reviewed publications, or are in current use. We conclude with the identification of challenges for future development of taxonomy comparison tools.
Keywords
Information visualization, biodiversity informatics, taxonomy, taxonomy comparison tools.
1. Introduction
Biological taxonomies are hierarchical structures that represent classifications of living organisms. Taxonomists, herbaria, natural history museums, and biodiversity initiatives worldwide classify biodiversity according to literature and other sources of information available to them, and to a choice of criteria that they recognize as valid. Consequently, it is not surprising that different classifications emerge and that there is disagreement in the scientific community about which classification is correct. To resolve these conflicts, taxonomists perform studies―called revisions―that could lead to other variants of the classifications. Taxonomists and global initiatives eventually need to reconcile these multiplicity in order to properly document biodiversity. Therefore, differences and similarities between such alternative taxonomies have to be identified. Since taxonomies can be large and the number of changes substantial, the support of software tools to carry out this endeavor becomes indispensable.
In this article we analyze information visualization tools designed to support comparison of biological taxonomies. We reviewed the tools and contrast them with ten user visualization tasks that we characterized in a previous work (
2. Background
The comparison of alternative classifications has long been a research topic in information visualization (
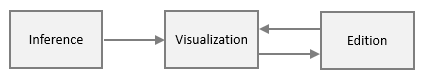
A hierarchy comparison tool is expected to receive as input at least two hierarchies and facilitate the visualization of similarities and differences. These similarities and differences could be indicated manually by experts, inferred by the software itself, or both. We consider that the process for the comparison and curation of taxonomies involves three components as illustrated in Fig.
We reviewed literature on tree visualization and comparison and identified information visualization tools for the comparison of biological taxonomies. Then we selected tools that have gone beyond the prototype stage and have been described in peer-reviewed publications or that are in current use. As a result, TreeJuxtaposer (
2.1 The tools
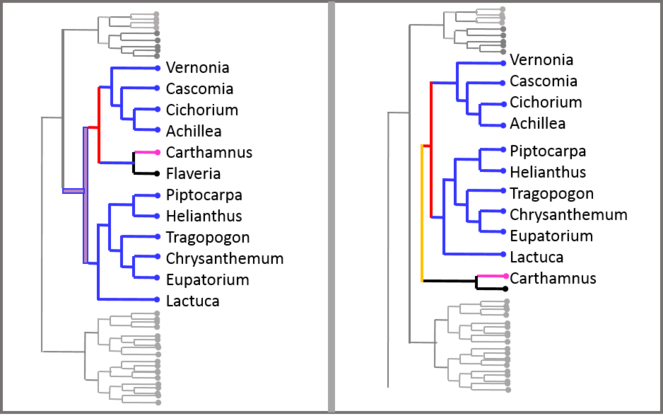
TreeJuxtaposer was created for the visual comparison of large trees, especially phylogenies, although it could be applied to other domains (
TaxVis (
The Taxonomic Tree Tool―TTT (
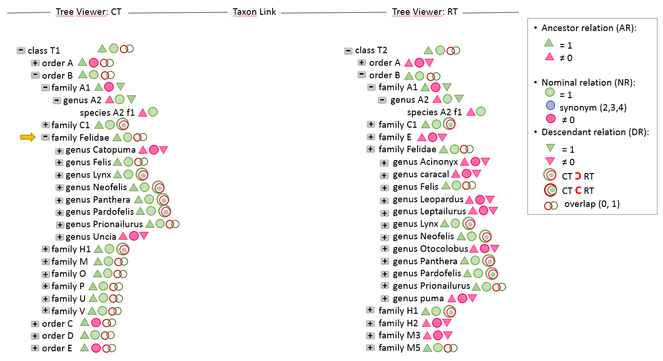
In the node-link layout, differences are color-coded. Users can filter by view type and visualize either overlaps, differences or both.
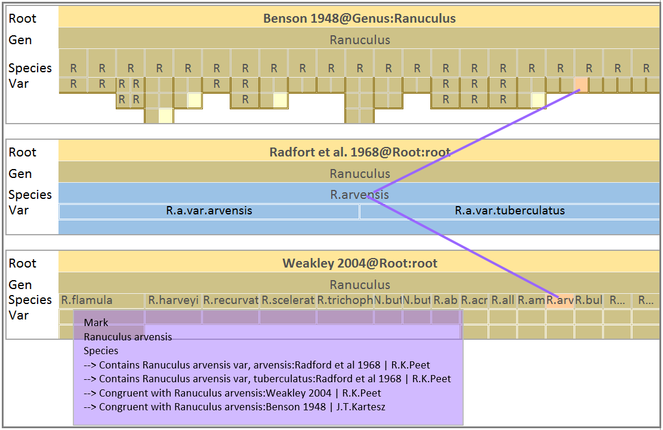
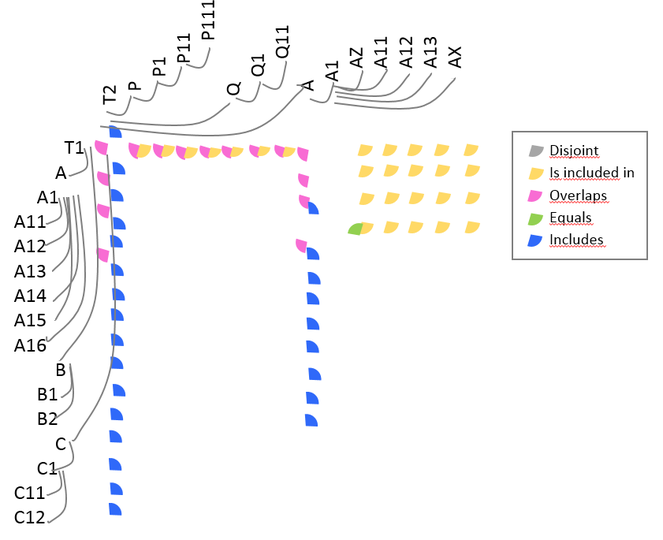
ProvenanceMatrix (
2.2 The tasks
The expert-provided tasks for the visual comparison of taxonomic changes are organized in three categories, namely, pattern identification, query, and edit. Pattern identification tasks provide a means to recognize specific differences and similarities between alternative classifications; query tasks allow users to inspect more detailed information; and edit tasks let users make modifications to the classifications. We describe each task as follows.
Pattern identification tasks:
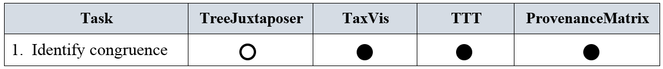
1. Identify congruence. Let T1 and T2 be alternative taxonomies. At the species level, congruence refers to equivalence of taxonomic concepts, and a concept is defined as the ordered triplet (scientific name, author, year). That is, species u in T1 is said to be congruent to species v in T2 when both species are identified by the same concept. At other higher level taxonomic ranks such as genus or family, a taxon p in T1 is said to be congruent to taxon q in T2 when both taxa have the same name.
2. Identify corrections. Differences between alternative taxonomies are due to revisions or to authors using different classification criteria. We consider the following four types of corrections: splits, merges, moves, and typos.
a) Identify splits: A split occurs when taxonomists divide one concept into two or more concepts. It is more likely that experts propose splits at lower level ranks, such as at family, genus, or species level. For instance, concept u in taxonomy T1 can be split into concepts v1, v2, ... vn in taxonomyT2 , where either u = v1 or u is a synonym of v1, and v2, ... vn are new concepts. An inference algorithm for the identification of splits would need the taxonomic history of the involved species.
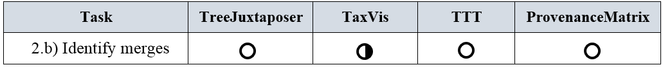
b) Identify merges: A merge occurs when taxonomists combine two or more concepts into one. It is more likely that experts propose merging concepts at lower level ranks, such as at the family, genus, or species level. For instance, concepts u1, u2, ... un in taxonomy T1 can correspond to concept v in taxonomy T2. At the species level, concepts u1, u2, ... un are registered as synonyms for concept v.
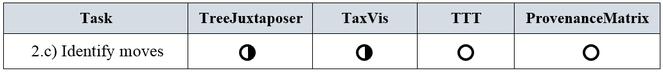
c) Identify moves: A concept can be identified as moved when it appears re-classified in another position of an alternative taxonomy; that is, a concept u in T1 is re-classified as concept v in T2 when parent(u) ≠ parent(v). An inference algorithm for the identification of moves would need the taxonomic history of the involved concepts.
d) Identify typos: A typo is a misspelling of a name.
3. Identify additions. Additions occur when new concepts are added to a taxonomy. In other words, concept v has been added to T2 if v ∈ T2 and v ∉ T1.
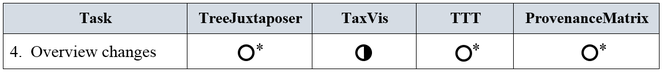
4. Overview changes. This task presents an overview of corrections and additions as stated in items 2 and 3 above.
5. Summarize. This task refers to obtaining a numerical understanding of change between taxonomies T1 and T2, for example, with respect to number of species, number of split cases, number of merge cases, amount and percentage of species added.
Query tasks:
6. Find inconsistencies. Inconsistencies are due to circumstances that go beyond the different types of corrections described above and that refer to violations of rules (e.g., repeated names within one taxonomy or missing names in a newer version of a taxonomy).
7. Filter. This task refers to finding cases that satisfy certain conditions. Through filter criteria users can visualize selected pieces of information. For example, filtering by author or by date.
8. Retrieve details. The goal of his task is to retrieve the attributes of a particular concept. For example, retrieve the details of a concept with name "Passiflora coriacea" will display data such as, author, year, and its list of synonyms.
9. Focus. Navigate to an area of interest, in order to see the information in greater detail.
Edit task:
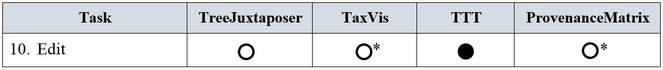
10. Edit. The goal of this task is to allow users to make changes in the classifications after analyzing the results of the comparison.
3. Methodology
Our starting point has been a list of tasks for the curation of biological taxonomies (
For this work we investigated tools for comparing biological taxonomies. As stated above, TreeJuxtaposer, TaxVis, The Taxonomic Tree Tool (TTT), and ProvenanceMatrix were selected considering that these are tools that go beyond the prototype stage, have been described in peer-reviewed publications, or are currently in use. Given that only TTT was available online, we contacted authors in order to confirm that we had suitable sources of information. Four out of the six contacted authors shared additional materials, such as links to the InfoVis 2003 Contest on Visualization and Pair Wise Comparison of Trees, users' guide of the tools, and links to source code. Since some tools were rather old and technology requirements were difficult to fulfill to make them run, publications, guides and presentations were our main sources of information.
To systematize the analysis we use the rating criteria indicated in Fig.
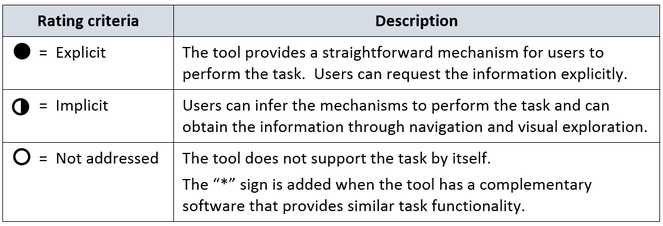
We built tables that present the assessment of each tool with respect to the tasks. Afterwards, we contacted authors again, shared the draft assessment of their tool and asked them for feedback. Three out of six authors replied. Authors agreed with most of the assessment results, they commented each evaluation and explained cases that they considered required more accuracy or detail. Lastly, we incorporated authors' feedback and performed a final analysis and assessment.
4. Assessment
This section presents the results of contrasting the four reviewed tools and the list of ten user tasks. The assessment is organized by task category.
4.1 Pattern identification tasks
1. Identify congruence. As summarized in Fig.
2. Identify corrections. Possible types of corrections are: splits, merges, moves, and typos.
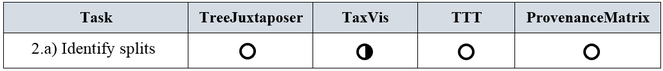
a) Identify splits
Let us recall that according to the definition of split in the list of requirements, a split occurs in a classification by decision of human experts. In order to identify that a taxon has been split, it is required to know its taxonomic history; that is, whether in the past it belonged to a more general concept. From our literature review we observed that the identification of splits was not a distinct requirement for any of the assessed tools, therefore none of the tools address this task in an explicit way (see Fig.
b) Identify merges
Analogous to the split subtask, the identification of merges was not a distinct requirement for the reviewed tools. A merged taxon can be determined by tracing its synonyms or when the concept relations are directly indicated. Since concept relations are given by experts in TaxVis, merges can be identified implicitly through visual exploration of correspondences between taxa. Merges do not occur in evolutionary trees, thus they are not considered in TreeJuxtaposer. TTT distinguishes synonyms by means of nominal relations but this is not enough to be able to visually find merges. Merges in ProvenanceMatrix might be discovered by a cumbersome exploration of the concept relations equals, includes, is included in, and overlaps, but the tool does not address splits as such. A summary of the ratings is presented in Fig.
c) Identify moves
A taxon can be moved by a taxonomist to another position within the classification when, according to expert criteria, the taxon should be re-classified. Fig.
d) Identify typos
None of the tools contains functionality to support this task.
3. Identify additions
In one way or another all tools support this task. In TreeJuxtaposer, added nodes are marked in red color, the task is supported in an explicit way. In TaxVis, when selecting a non-leaf node, its corresponding descendants are highlighted within the alternative taxonomies; so, users can identify additions, in an implicit way, by performing visual identification of differences. In TTT, the red glyphs that represent no ancestor relation and the red glyps that indicate no nominal relation imply that new nodes have been added; thus we consider that TTT supports this task in an explicit way. In ProvenanceMatrix, this task is also approached in an explicit way: non-congruent nodes indicated in red color correspond to new nodes added to the taxonomy.
4. Overview changes
All tools visualize changes, but most of them do not exactly comply with the definition of task overview changes in the list of requirements (see Fig.
5. Summarize.
All tools present at least some basic numerical information in an explicit way. TreeJuxtaposer approaches this task through the find function and displays the amount of named nodes within a selected taxonomy. TaxVis displays the amount of subtaxa of a selected taxa and its percentage relationship with respect to a compared classification. TTT provides a wide range of statistics on taxons and on structure. Statistics on taxa are amount of orders, classes, families, genera, and species. Statistics on structure also indicate amount of equal taxa, amount of overlapped taxa, and amount of unmatched taxa for each taxonomic rank. ProvenanceMatrix provides a bubble chart that visualizes the proportion of each type of articulation.
4.2 Query tasks
6. Find inconsistencies
None of the tools supports this task.
7. Filter
TaxVis and ProvenanceMatrix support this task in an explicit way, whereas TreeJuxtaposer and TTT do not support it at all. TaxVis has a filter relations menu that allows the visualization of congruent, contains, included, overlaps, and is not congruent with relations. TreeJuxtaposer does not handle attributes, therefore it cannot filter attributes. ProvenanceMatrix provides filtering through different types of articulations.
8. Retrieve details
All tools support this task in an explicit way. TreeJuxtaposer includes a search by name mechanism. TaxVis retrieves the information of a node after selecting it. TTT provides a search-by scientific name feature. ProvenanceMatrix retrieves the data through a mouse-over operation and also pictures are retrieved from Wikipedia.
9. Focus
All tools except TTT feature focus mechanisms explicitly. TreeJuxtaposer achieves this task through features such as guaranteed visibility, accordion, lens and mouse pointer. In TaxVis this tasks is performed through increasing the size of selection. ProvenanceMatrix approaches this task by collapse, expand, resize, and order by features.
4.3 Edit task
10. Edit
The comparison through visualization provides users with an understanding of differences and similarities between taxonomies, and afterwards editing becomes necessary. Only TTT provides functionality for this task, and it is explicit. Although TaxVis and ProvenanceMatrix do not approach this task, they both have complementary tools for this functionality. TaxVis edition complementary tool is the Concept Relationship Editor (CRE) and ProvenanceMatrix´s is EULER/X ‒ a multi-taxonomy alignment tool. The assessment is presented in Fig.
5. Conclusions
The assessment of the four biological taxonomies comparison tools reveals distinct approaches among tools, as well as different levels of support for the defined tasks. Considering approaches, TreeJuxtaposer uses dendrograms and focuses on visualizing structural differences; TaxVis uses an adjacent set-based type layout and its main focus is on visualizing a genus-corresponding species within the other classifications; TTT uses indented lists and concentrates on visualizing similarities and differences through ancestor, descendant, and nominal relations; and ProvenanceMatrix implements a matrix approach to visualize the correspondences between taxonomies after applying expert assertions to relate concepts. All tools take advantage of color to highlight similarities and diferences.
Regarding the defined tasks, Fig.
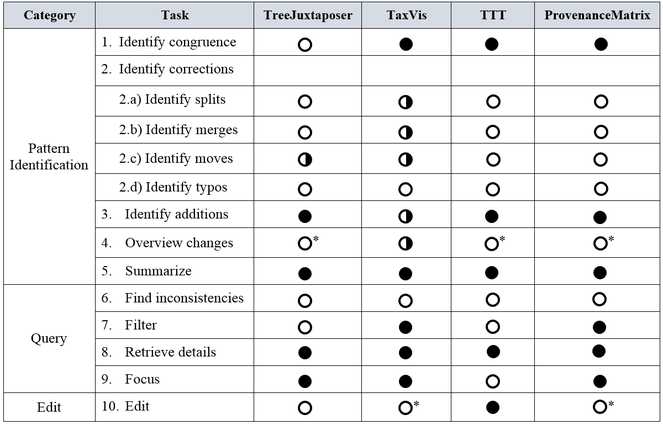
As mentioned before, the assessed tools respond to requirements established at the time they were conceived. However, given that they are hierarchy comparison tools, they have certainly a correspondence with several of the expert-provided tasks described above, although they also present several gaps that are indicated in Fig.
In summary, this work reveals lack of support for certain tasks in the assessed tools; specifically for identify splits, identify merges, identify moves, identify inconsistencies and edit. Given the importance of these tasks for taxonomic work, this clearly suggests that future work should investigate suitable visualization approaches to fill these gaps.
Acknowledgements
The authors would like to thank Nico Franz, Martin Graham, Jessie Kennedy, and Tamara Munzner for their feedback on available sources of information and on our draft assessment of the tools.
References
-
Euler/X: a toolkit for logic-based taxonomy integration.arXiv. 2014;1402:1992.URL: http://arxiv.org/abs/1402.1992
-
ProvenanceMatrix: A Visualization Tool for Multi-Taxonomy Alignments.vol. 1456.CEUR Workshop Proceedings,13-24pp.
-
On the Use of Taxonomic Concepts in Support of Biodiversity Research and Taxonomy.Systematics Association Special Volumes.61-84pp. https://doi.org/10.1201/9781420008562.ch5
-
A Comparison of Set-Based and Graph-Based Visualisations of Overlapping Classification Hierarchies.Proceedings of the Working Conference on Advanced Visual Interfaces 2000.ACM Press,Palermo, Italy,41-50pp. https://doi.org/10.1145/345513.345243
-
Visual exploration of alternative taxonomies through concepts.Ecological Informatics2(3):248‑261. https://doi.org/10.1016/j.ecoinf.2007.07.004
-
Visualisation to Aid Biodiversity Studies through Accurate Taxonomic Reconciliation. In: A. Gray KJaJS (Ed.)Lecture Notes in Computer Science.vol. 5071.Proc. of British National Conference on Database Systems: Sharing Data, Information and Knowledge,Cardiff, United Kingdom,280-291pp. https://doi.org/10.1007/978-3-540-70504-8_29
-
A Survey of Multiple Tree Visualisation.Information Visualization9(4):235‑252. https://doi.org/10.1057/ivs.2009.29
-
Taxonomic Tree Tool. http://ttt.biodinfo.org/. Accessed on: 2017-8-30.
-
TreeJuxtaposer: Scalable Tree Comparison using Focus+Context with Guaranteed Visibility.ACM Transactions on Graphics22(3):453-462. https://doi.org/10.1145/882262.882291
-
Visual Comparison of Biological Taxonomies: A Task Characterization.Poster session presented at EuroVis 2016.