|
Research Ideas and Outcomes : Research Article
|
|
Corresponding author: Ross Mounce (ross.mounce@gmail.com)
Received: 08 May 2017 | Published: 09 May 2017
© 2018 Ross Mounce, Peter Murray-Rust, Matthew Wills
This is an open access article distributed under the terms of the Creative Commons Attribution License (CC BY 4.0), which permits unrestricted use, distribution, and reproduction in any medium, provided the original author and source are credited.
Citation: Mounce R, Murray-Rust P, Wills M (2017) A machine-compiled microbial supertree from figure-mining thousands of papers. Research Ideas and Outcomes 3: e13589. https://doi.org/10.3897/rio.3.e13589
|
|
Abstract
Background
There is a huge diversity of microbial taxa, the majority of which have yet to be fully characterized or described. Plant, animal and fungal taxa are formally named and described in numerous vehicles. For prokaryotes, by constrast, all new validly described taxa appear in just one repository: the International Journal of Systematics and Evolutionary Microbiology (IJSEM). This is the official journal of record for bacterial names of the International Committee on Systematics of Prokaryotes (ICSP) of the International Union of Microbiological Societies (IUMS). It also covers the systematics of yeasts. This makes IJSEM an excellent candidate against which to test systems for the automated and semi-automated synthesis of published phylogenies.
New information
In this paper we apply computer vision techniques to automatically convert phylogenetic tree figure images from IJSEM back into re-usable, computable, phylogenetic data in the form of Newick strings and NEXML. Furthermore, we go on to use the extracted phylogenetic data to compute a formal phylogenetic MRP supertree synthesis, and we compare this to previous hypotheses of taxon relationships given by NCBI’s standard taxonomy tree. This is the world’s first attempt at automated supertree construction using data exclusively extracted by machines from published figure images. Additionally we reflect on how recent changes to UK copyright law have enabled this project to go ahead without requiring permission from copyright holders, and the related challenges and limitations of doing research on copyright-restricted material.
Keywords
Phylogenetics, Supertree, Microbes, Systematics, Computer Vision, Synthesis, Data Re-use, Data Extraction
Introduction
A recent study estimated that there are more than 114,000,000 documents in the published scientific literature (
-
The data underlying articles are often not published in the first place (
Wicherts et al. 2006 ,Stoltzfus et al. 2012 ,Drew et al. 2013 ,Magee et al. 2014 ,Caetano and Aisenberg 2014 ) -
Some journals allow data to be "embargoed" and not made available for up to 10 years after the publication of an associated article (
Roche et al. 2014 ) -
When data are published, it can be in a manner that is not machine-readable. Data are frequently obfuscated in pixel-based figures, and even where data are tabulated the formatting is often esoteric. Metadata often lack unambiguous identifiers.
-
Articles are frequently published in subscription journals to which potential re-users of information do not have access.
-
Published data can disappear over time because there is no sustainable long term archiving (
Vines et al. 2014 ) -
There are frequently copyright-imposed restrictions on the re-use and modification of published content (
Hagedorn et al. 2011 ,Taylor 2016 ,Egloff et al. 2017 )
In this paper, we present the results of our efforts to extract phylogenetic data from images contained in the primary research literature. We acknowledge the many previous efforts to extract phylogenetic information from figured trees, including TreeThief (
Scholarly literature as BigData
The international corpus of public scholarly literature now has many of the features and problems of 'Big Data'. In particular, we highlight four issues:
-
Volume. About 2.7 million scholarly objects receive CrossRef DOIs, of which about 2.2 million are 'articles' of some sort. Assuming, for illustrative purposes, that an article (with supplemental data and images) requires ca 10 MBytes, this equates to in the region of 30 Terabytes. Although a moderate volume of data by some standards (those repositories archiving the results of High Energy Particle [HEP] physics, or the Square Kilometer Array [SKA]) this is still more than most researchers or teams can analyse or utilise. The majority of this information is in Scientific/Technical/Medical disciplines (STM).
-
Velocity. Assuming 50 working weeks of 40 hours each (2000 hours/year), this volume arrives at 15 GB/hour or 4 Mb / second. This equates to 2.5 million articles per year, or 1000 titles per hour (
Ware and Mabe 2015 ). We are now at the stage where no individual can read even the titles of published scholarship, let alone the abstracts. -
Variety. Some big data (e.g. from instruments such as ATLAS [
Doglioni 2012 ] or the SKA [Carilli and Rawlings 2004 ]) is highly structured with clear schemas. Much of the remainder, however, is unstructured or at best semi-structured. Most scientific publications consist of human readable text with non-semantic document structure and implicit semantics. Moreover this is highly variable: there are over 28,000 STM journals and each has their own approach to semi-structure (Ware and Mabe 2015 ). -
Veracity/Validity/Verification. Can we use machines to establish the degree of trust that we can put in data? More specifically, can we reliably read and interpret the information in the way that the community expects? We are concerned with the semantic definition of the information and its schema-validity (does it conform to an implicit/explicit specification?) and value-validity (are the values captured accurately).
We believe that machines are now essential to enable us to make sense of the stream of published science, and this paper addresses several of the key problems inherent in doing this. We have deliberately selected a subsection of the literature (limited to one journal) to reduce the volume, velocity and variety axes, concentrating primarily on validity. We ask whether high-throughput machine extraction of data from the semistructured scientific literature is possible and valuable.
Phylogenetic Trees
We chose to extract phylogenetic trees and combine them into a supertree: a process that is both tractable and useful. Phylogenetic trees are inferred from the distributions of putatively homologous characters (or traits) of organisms, resulting in one or more variously optimal trees as the output from an analysis. Computing a well-supported phylogenetic tree can entail many tens or hundreds of CPU hours. Because of this expense, trees are usually inferred for a small subset of species or 'leaves' (perhaps 10 to 500) rather than for all of those available. Each tree created and published is therefore a small but important contribution to our understanding of the classification and relationships of taxa.
Methods for synthesising larger trees ('supertrees') from a collection of smaller trees exist, but supertrees are rarely created because of the scarcity of published trees in semantic, re-usable forms (
Phylogenetic trees are usually represented diagrammatically, with a topological object isomorphous to a tree with nodes and edges. There are several major styles, but the commonest is a set of edges, normally orthogonal, meeting at (often undistinguished) nodes where three or more edges meet. The tree is normally 'rooted' (i.e. one node is nominated as the root), but this root is often implicit (at the midpoint of the 'top' edge). The tree is often directional, with the root usually (but not always) either on the left or at the bottom of the diagram, and the 'leaves' or 'tips' opposite the root. The tips (univalent nodes) are almost always labelled with text (e.g. the name of the species or higher taxa constituting the tree). The internal, multivalent nodes are often unlabelled, but may also have annotations such as confidence limits, support measures, pie charts, or the names of higher groups. The edges often have right-angle bends, but may be variously angled or even curved. These differences are usually solely cosmetic, and have no biological or other significance. The diagram is potentially semi-metric: distances along the root-tip direction (we shall use h to denote this as x and y are frequently interchanged) may sometimes represent the similarity between daughter nodes. Distances in the other direction (w) are usually meaningless as is the order of tips: only the ancestry of nodes is relevant. Very occasionally, fonts and weights are used to convey information but these nuances have been ignored. The thickness of lines is normally irrelevant, as are the colours of lines, leaf names and other labels.
In some cases, two or more trees are presented in a single diagram. Sometimes they are multiple trees for different leaf sets, using the same h-direction. At other times they are multple trees for the same leaf set and may be oriented tip-to-tip (h and -h) to show similarities and differences. Tips can be annotated with bars or checkerboards in the w-direction (e.g. to show clades, geographical distributions of leaves or other data). Further decorations include non-orthogonal arrows and schematic images of species.
In essence, therefore, a tree is described by a collection of nodes with (h,w coordinates), associated labels, a root node, and inter-node edges. Omitting the meaningless w, we can represent this in Newick (Lisp-like) or NeXML (XML) formats without loss of essential information other than elements of visual style.
Legal Aspects
The re-use of data from the scientific literature is potentially a major ‘good’, and many policy makers are pushing for liberalisation of access to - and re-use of - published science. 'Text and Data Mining' (or as we prefer, 'Content Mining') is now actively promoted for reform, especially in Europe. Unfortunately electronic documents are formally covered by copyright, which acts as a major barrier to re-use for legally-aware scientists. We also suspect that many scientists knowingly and routinely infringe copyright:
“I hardly know any scientists who don’t violate copyright laws. We just fly below the radar and hope that the publishers don’t notice.” -- Anonymous scientist quoted in
We (RM and PMR), have been involved in the proposed European copyright reform and note:
- Copyright is absolute and complex. Almost all documents that we have mined are copyrighted, and it is usually unclear what rights the researcher has and what risks they undertake. It is also jurisdiction-dependent and a work may fall under more than one jurisdiction.
- Two main approaches are: (a) to seek permission from every copyright holder, and if necessary pay a licence fee or (b) to contend that the law allows the present activity under exceptions and precedent. There is relatively little certainty in (b) and the researcher runs the risk of being accused of copyright infringement.
- Images have often had a special position as they are often regarded by the author or copyright-holder as 'creative works' (but see
Egloff et al. 2017 for an alternative view which we support).
In this research we have taken route 2(b) and used material to which we have legitimate access. Since we all work in the UK and are funded by UK institutions (including Research Councils) we refer to UK law (but are not formally making a legal case here). The seminal aspects are:
- Facts are uncopyrightable. We contend that much of the information we use (including the hierarchical structure of phylogenetic trees) is factual - a record of work performed by the authors, not capable of creative interpretation or re-expression.
- The UK Copyright reform (2014) allows for copying for mining (data analytics) and other non-commercial research purposes.
- The same reform allows for 'fair quotation', which we contend allows us to embed the extracted facts in enough context to make scientific sense.
We offer the output as facts, and assign them to the public domain by using the CC0 waiver of Creative Commons.
Materials and Methods
Prior work (

Content acquisition:
Full text articles were systematically downloaded from the IJSEM website as PDF files using the open source command-line program GNU Wget version 1.15. An eleven-year span of articles was downloaded, from January 2003 (Volume 53, Issue 1) through to December 2013 (Volume 63, Issue 12) inclusive. From each publication year, Tables of contents (TOCs) and full text PDF links were extracted and subsequently downloaded with Wget. No distinction was made between research articles, editorial matter and erratums; all were downloaded. A total of 5,816 source PDFs were obtained in this manner. PDF filenames were renamed by their unique partial DOI to aid provenance tracking (e.g. ijs.0.004572-0.pdf corresponds to the article which is available for 'free' via this URL: http://dx.doi.org/10.1099/ijs.0.004572-0). Electronic supplementary material was neither examined nor downloaded for the purpose of this analysis. At the time these downloads were undertaken, the IJSEM website was managed by Highwire Press. It has since been ported to a new Ingenta platform with a significantly different structure.
Extraction and isolation of images from their PDF containers:
The open source command-line program pdfimages version 0.25.0 (part of the Poppler library: http://poppler.freedesktop.org/) was used to automate the extraction and isolation of all figure images from each PDF. A total of 8,221 source images were extracted from the 5,816 source PDFs. Each source image was named according to the unique DOI of the PDF it came from, plus a three digit identifier to indicate which image it was in the PDF (e.g. ijs.0.004572-0-000.jpg, ijs.0.004572-0-001.jpg, ijs.0.004572-0-002.jpg, reflecting the sequence in which the images appeareed throughout the PDF).
Selection of phylogenetic tree images:
All 8,221 images were loaded into Shotwell version 0.17.0, an open-source GUI image management program. One of us (RM) manually tagged all phylogeny-containing figure images, resulting in a selection of 4,336 images that contained a dendrogram of some form or another. This manual process took about 5 hours. This phylogeny selection set was exported (copied) using Shotwell to its own clean directory path, safely away from the non-phylogeny images for further processing. In retrospect, and with the application of some machine learning techniques, we could probably have automated this step too, with a high degree of precision and recall.
Converting raster images to re-usable phylogenetic data:
The set of 4,336 images containing a phylogeny (e.g., Fig.
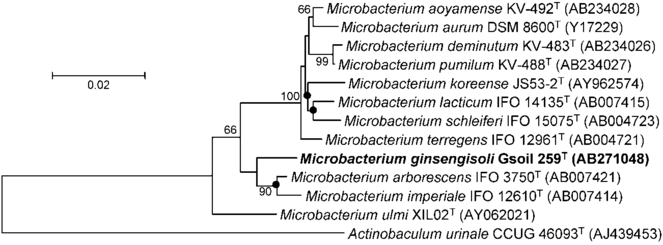
A typical source input tree raster image (figure 1 from
Problems included:
-
the quality of the target image
-
the types of graphic object to be extracted,
-
the natural language in the diagram,
-
the error rate in creating the image
-
orthogonal sources of information
-
complexity
In this project we explored several possible approaches before alighting upon a scheme that worked well.
In general anyone wanting to use diagram mining in science should ask; is the image the original or a copy? Copies (such as photographs, photocopying, scanning) may introduce noise, distortion, contrast, antialiasing, bleeding, holes and line breaks. Fully computer generated images have the benefit of consistency, but sometimes introduce artefacts such as drawing lines twice for emphasis. In this paper we exclusively utilise machine generated diagrams.
We focused upon IJSEM because it is a key microbiological journal, and because papers within it follow the same systematic layout. Each new species to be described was placed within a phylogeny, and almost all papers therefore contained one or more trees. Tree figures in IJSEM are typically created with the same software, and the resultant diagrams are all oriented similarly, have the same font-set and the same semantics. These figures also typically include Genbank accession numbers alongside each taxon (or terminal leaf) so that their identity can be verified. Unlike at many other journals, IJSEM uses a minimum of extraneous graphics in phylogeny figure images, avoiding 'chartjunk' (sensu
The process of tree and tip data extraction required the following operations:
-
Identify all characters
-
Aggregate these into 'words' and 'phrases'
-
Interpret phrases and check for correctness. The main tool was 'lookup' in 'Genbank' and other resources for taxonomy
-
Identify all paths (lines and curves)
-
Build these into a tree
-
Identify errors
We experimented with several methods including:
-
Writing our own OCR software
-
Edge detection and fitting lines
-
Identifying horzontal and vertical lines
Ultimately, we converged on:
-
Tesseract (
Smith 2007 ) for optical character recognition -
Our own software for phrase detection
-
Zhang-Suen Thinning (
Zhang and Suen 1984 ) -
Recreation into connected graphs
-
Image Segmentation (
Blanchet and Charbit 2013 )
Because the images were strictly binary, there was no need for contrast manipulation, binarization or posterization. However we needed to determine the nodes and edges of the source tree. Fortunately, the only information required was the coordinates of the nodes (either tips with 1 edge or nodes where 3 or more edges met). The edge thickness, texturing, and 'kinks' of internal branches are purely stylistic. Thinning reduces all connectivity to a single pixel edge. We wrote a superthinning algorithm to require every pixel to be either in a node, 2-connected in an edge, or a tip. We included diagonal connectivity in all algorithms.
The phrases (e.g. species binomial names and Genbank accession numbers) were extracted as follows:
-
The diagram was binarised, but not thinned.
-
The binarised file was submitted to Tesseract. This extracted characters and assembled words from pixels (e.g., 'Pyramidobacter', 'Jonquetela', 'Anthropi'). By computing the bounding boxes we were able to compute inter-word vectors and deduce whether these were sequential on a horizontal line, or vertical (different lines).
-
We cross-checked putative Genbank accessions numbers against NCBI's records. This is a very strong check on correctness.
-
Taxon labels were attached to the tips. This is an easy operation for humans, but not trivial for machines, since there is often variation in how authors add name annotations.
Once these operations were complete, tip labels and graphs were combined into NeXML format.
MRP-matrix creation:
After taxon-name standardisation across the 924 source Newick strings, trees were converted into a matrix-representation with parsimony (MRP) matrix using the open source command-line programme mrpmatrix (https://github.com/smirarab/mrpmatrix,
Analysis of the MRP matrix using Maximum Parsimony
The MRP matrix was analysed with the closed source command-line programme TNT version 1.1 (
To compare our supertree to the NCBI taxonomy tree, a pruned NCBI taxonomy tree with labels exactly matching the 2,269 in our supertree was created using PhyloT (http://phylot.biobyte.de/). Descriptive statistics for both the supertree and the pruned NCBI taxonomy tree, relative to the MRP matrix, were calculated in PAUP* version 4.0b10 (
Open Notebook Science working practices
When this study was initiated (early 2013), the primary emphases were on methodology and extraction of scientific results. At that time, the UK had not enacted the 'Hargreaves' copyright exception allowing mining and fair quotation, and so we could not start with a completely 'Open' methodology. Nevertheless, our tools were developed in the expectation that copyright would be liberalised in the UK, and that it would be possible to mine images on a large scale. In 2014-17 the exception was enacted and we were able to partially implement an 'Open Notebook Science' (
- All results are captured and saved immediately. There is no process of 'writing up' (revisiting discourse and data from disparate sources which are often difficult to find). ONS saves components in persistent, versioned repositories where data never 'gets lost' and where the history of operations can be completely recovered.
- The results are shared within and beyond the team. There is no need to e-mail or otherwise distribute versions of the data, since everyone shares the same pointers/addresses to the data. The systems allow branching ('forking') so that experiments (e.g. re-analyses) can be carried out without corrupting the data.
- In some projects, the wider community can communicate with the project and re-use the data, add observations or in some cases even become active contributors to the project.
- Increased quality, often encouraged by having the raw data available to everyone immediately. F/LOSS puts a high value on validation and communally agreed quality. This is often done automatically ('unit and integration tests') so that the project knows that code is fit for purpose without having to check history. This is harder for data and discourse, but it is possible to check that all components are present and reviewed by humans or machines.
ONS is relatively new and there are fewer systems available to support it. Our ONS software stack was based on freely usable repositories on Github (https://github.com/ContentMine/ijsem) and Bitbucket (https://bitbucket.org/petermr/ami-plugin), with open communications hosted on a Discourse installation (https://github.com/discourse/discourse ; http://discuss.contentmine.org/c/community/phylogeny) as used by rOpenSci (https://discuss.ropensci.org/) amongst other projects. Since we only introduced ONS halfway through the project, we decided to use Git to support our repositories and Disqus to support threaded, searchable discourse.
Data resources
Due to copyright restrictions imposed by the publisher of IJSEM, we do not feel that we can safely share all of the 5,816 source PDFs or the 8,221 figure images we found in those PDFs, that are used or refered-to in this study. However, we do provide a list of the URLs of these 5,816 publications as supplementary material (Suppl. material
Results
The automated image processing was a lossy-process (see Fig.
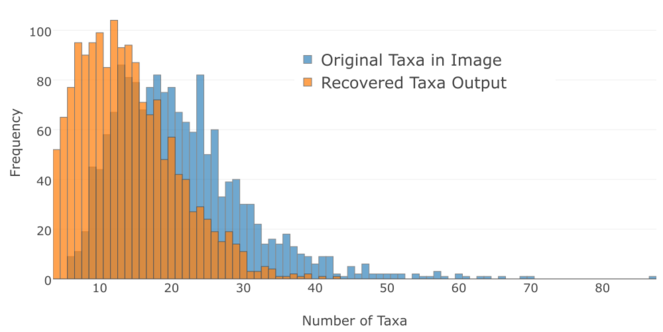
Number of leaves (terminal taxa) in each of 1614 source tree images (blue) and number of leaves recovered-from each image (orange). The modal number of taxa recovered per image was 12, the median was 13, and the mean was 13.96. The modal number of taxa not recovered from the trees was 2, the median was 5 and the mean was 7.15. The image mining process is lossy since most output tree files did not recover all of the taxa from the source image.
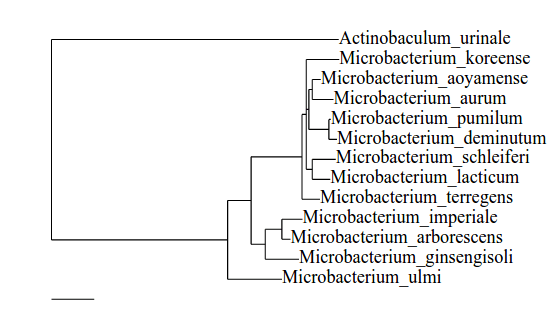
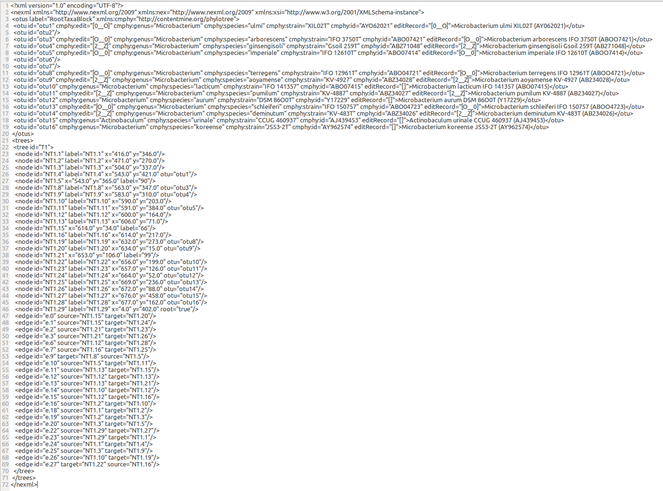
Screenshot of exemplar machine-readable NeXML formatted data output from our automated analysis of the figure image from figure 1 of
These 924 Newick format tree files were then concatenated into one file, in a known order to preserve the chain of data provenance. We determined that 48 taxon labels in the 924-source-tree-set represented non-specific or environmental taxa such as "Marine clone", "Peat bog", "Leptotrichia oral", "Human colonic", "Hot spring", "Halophilic bacterium", "Sea urchin" and "Termite gut" These 48 taxa were deleted from the 924 source Newick trees.
Many of the taxon name strings given in each of the 924 source tree Newick strings were either misspelt through OCR errors, were invalid synonymous taxon names relative to modern NCBI taxonomy, or had only a species name (with no genus given). Across the 924 source trees supplied from ami-phylo, there were 1,742 unique taxon name strings encountered that did not initially match existing and valid NCBI binomial names. We used the open source command-line program tre-agrep 0.7.2 (http://packages.ubuntu.com/xenial/tre-agrep) to help semi-automate the re-matching of incorrect names to correct names by comparing each OCR’d taxon name string to valid taxon names in NCBI’s taxdump and suggesting the best match. After human-review, it was determined that tre-agrep using Levenshtein edit-distance matching alone correctly suggested the correct name for 1417 out of 1742 (81%) of the non-matching OCR’d name strings. We acknowledge but did not use the Taxamatch algorithm (
Supertree Analysis Results
The maximum parsimony analysis of the MRP matrix timed-out after 24-hours, equating to 40 random addition sequence searches. The best (shortest) tree length was 7,834 steps (Fig.
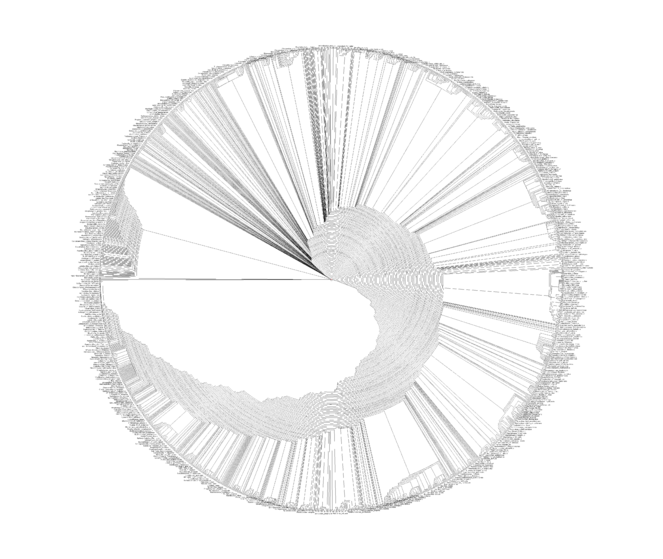
In terms of tree-to-tree distance measures, the supertree and the pruned NCBI taxonomy tree are clearly different: the Robinson-Foulds distance (
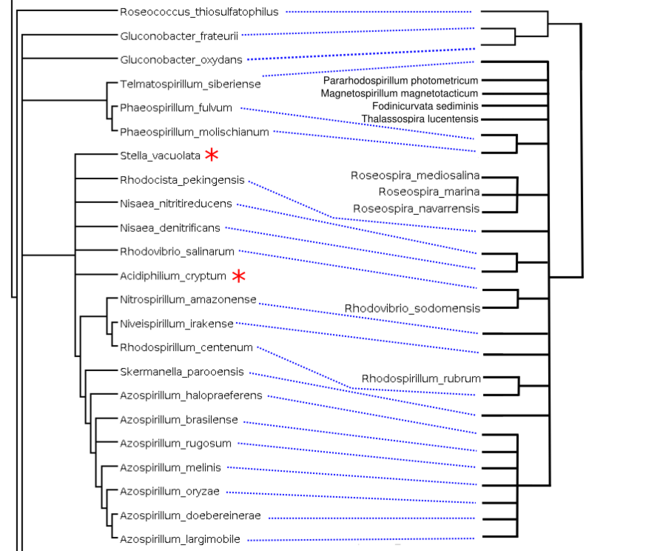
Comparison between our supertree (left) and the NCBI Taxonomy reference tree (right): This example section of the supertree corresponds to taxa mostly from Rhodospirillaceae with the exception of rogue taxa indicated with a red asterisk. This section is related to the NCBI taxonomy reference tree on the right, containing those Rhodospirillaceae species leaves included in the supertree analysis (27). Nine taxa out of the 27 Rhodospirillaceae included were reconstructed elsewhere in our supertree (not shown). This is representative of the phylogenetic placement errors found throughout the supertree: individual rogue taxa, as well as misplaced clades of related taxa.
Instead we used alternative measures of tree-to-tree distance to complement the Robinson-Foulds distance. The following tree-to-tree comparisons between our supertree and the NCBI taxonomy tree for the same set of 2269 taxa were all calculated with Dendroscope version 3.5.8 (
Tripartition distance (
Nested labels distance (
Hardwired cluster distance (
Softwired distance (
Path multiplicity distance (
We tried to compute the significance of difference between our supertree and the NCBI taxonomy tree but found that neither PAUP* (
Discussion
The PLUTo workflow implements several key advances simultaneously:
Optical Character Recognition combined with 'Optical Tree Recognition' so that phylogenetic branch lengths and relationships and tip-label data are recovered from an image, correctly matched-up with tips and output into an immediately re-usable format for further phylogenetic analysis .
This is one of the largest formal supertree syntheses ever created in terms of source trees used and number of tips feeding into the MRP-matrix (see Table
A comparison of the size of our supertree and other published formal supertrees. This tabulation is not intended to be exhaustive. Supertree studies have been omited if it was unclear how many source trees contributed to the supertree, or if the supertree study was superseded by a newer and more inclusive study.
| Taxon-focus | Number of Source Trees | Number of Tips | Year of Publication | Bibliographic Source |
| Microbial taxa | 924 | 2269 | 2017 | (this study) |
| Teleostei | 120 | 617 | 2016 |
|
| Philodendron and Homalomena | 6 | 89 | 2016 |
|
| Anomura | 60 | 372 | 2016 |
|
| Pseudogymnoascus | 125 | 23 | 2016 |
|
| Marseilleviridae | 5 | 9 | 2016 |
|
| Ornithopoda | 5 | 112 | 2016 |
|
| Decapoda: Achelata | 55 | 475 | 2015 |
|
| Birds | 1036 | 6326 | 2014 |
|
| Lissamphibians | 89 | 319 | 2013 |
|
| Crocodyliformes | 124 | 245 | 2012 |
|
| Carnivora | 188 | 294 | 2012 |
|
| Corals | 15 | 1293 | 2012 |
|
| Hymenoptera | 77 | 134 | 2010 |
|
| Dogfish sharks | 11 | 24 | 2010 |
|
| Galloanserae | 400 | 376 | 2009 |
|
| Mammalia | (not specified) | 5020 | 2009 |
|
| Cyprinidae | 56 | 397 | 2009 |
|
| Dinosauria | 165 | 455 | 2008 |
|
| Adephaga | 43 | 309 | 2008 |
|
| Drosophilidae | 117 | 624 | 2008 |
|
| Temnospondyli | 30 | 173 | 2007 |
|
| Ruminantia | 164 | 197 | 2005 |
|
| Cetartiodactyla | 141 | 290 | 2005 |
|
| Angiosperms | 46 | 379 | 2004 |
|
Post-hoc analyses
After writing-up most of this paper, one of us (RM) attended a workshop hosted by the authors of the Supertree Toolkit (
Acknowledgements
We would like to thank Jon Hill and Katie Davis for providing expert guidance in the usage of STK2 software.
Funding program
BBSRC Tools and Resources Development Fund (TRDF)
Grant title
PLUTo: Phyloinformatic Literature Unlocking Tools. Software for making published phyloinformatic data discoverable, open, and reusable. We are grateful to the BBSRC (grant BB/K015702/1 awarded to MAW and supporting RM) for funding this research.
Hosting institution
The University of Bath
References
-
A genus-level supertree of Adephaga (Coleoptera).Organisms Diversity & Evolution7(4):255‑269. https://doi.org/10.1016/j.ode.2006.05.003
-
An Introduction to Image Processing.Digital Signal and Image Processing using MATLAB®. https://doi.org/10.1002/9780470612385.ch6
-
TreeCmp: Comparison of Trees in Polynomial Time.Evolutionary Bioinformatics475. https://doi.org/10.4137/ebo.s9657
-
Open Notebook Science Using Blogs and Wikis.Nature Precedingshttps://doi.org/10.1038/npre.2007.39.1
-
A species-level supertree of Crocodyliformes.Historical Biology24(6):598‑606. https://doi.org/10.1080/08912963.2012.662680
-
Forgotten treasures: the fate of data in animal behaviour studies.Animal Behaviour98:1‑5. https://doi.org/10.1016/j.anbehav.2014.09.025
-
Comparison of Tree-Child Phylogenetic Networks.IEEE/ACM Transactions on Computational Biology and Bioinformatics6(4):552‑569. https://doi.org/10.1109/tcbb.2007.70270
-
On Nakhleh's Metric for Reduced Phylogenetic Networks.IEEE/ACM Transactions on Computational Biology and Bioinformatics6(4):629‑638. https://doi.org/10.1109/tcbb.2009.33
-
Motivation, key science projects, standards and assumptions.New Astronomy Reviews48:979‑984. https://doi.org/10.1016/j.newar.2004.09.001
-
Little evidence for enhanced phenotypic evolution in early teleosts relative to their living fossil sister group.Proceedings of the National Academy of Sciences113(41):11531‑11536. https://doi.org/10.1073/pnas.1607237113
-
Darwin's abominable mystery: Insights from a supertree of the angiosperms.Proceedings of the National Academy of Sciences101(7):1904‑1909. https://doi.org/10.1073/pnas.0308127100
-
Towards a Supertree of Arthropoda: A Species-Level Supertree of the Spiny, Slipper and Coral Lobsters (Decapoda: Achelata).PLOS ONE10(10):e0140110. https://doi.org/10.1371/journal.pone.0140110
-
Global cooling as a driver of diversification in a major marine clade.Nature Communications7:13003. https://doi.org/10.1038/ncomms13003
-
The Supertree Tool Kit.BMC Research Notes3(1):95. https://doi.org/10.1186/1756-0500-3-95
-
Reweaving the Tapestry: a Supertree of Birds.PLoS Currentshttps://doi.org/10.1371/currents.tol.c1af68dda7c999ed9f1e4b2d2df7a08e
-
The origins of species richness in the Hymenoptera: insights from a family-level supertree.BMC Evolutionary Biology10(1):109. https://doi.org/10.1186/1471-2148-10-109
-
A supertree analysis and literature review of the genus Drosophila and closely related genera (Diptera, Drosophilidae).Insect Systematics & Evolution39(3):241‑267. https://doi.org/10.1163/187631208788784237
-
The ATLAS Experiment.Springer Theses. https://doi.org/10.1007/978-3-642-30538-2_3
-
A Brazilian Marseillevirus Is the Founding Member of a Lineage in Family Marseilleviridae.Viruses8(3):76. https://doi.org/10.3390/v8030076
-
Lost Branches on the Tree of Life.PLoS Biology11(9):e1001636. https://doi.org/10.1371/journal.pbio.1001636
-
Copyright and the Use of Images as Biodiversity Data.Research Ideas and Outcomes3:e12502. https://doi.org/10.3897/rio.3.e12502
-
A phylogenetic supertree of the fowls (Galloanserae, Aves).Zoologica Scripta38(5):465‑481. https://doi.org/10.1111/j.1463-6409.2008.00382.x
-
THE RETENTION INDEX AND THE RESCALED CONSISTENCY INDEX.Cladistics5(4):417‑419. https://doi.org/10.1111/j.1096-0031.1989.tb00573.x
-
A complete estimate of the phylogenetic relationships in Ruminantia: a dated species-level supertree of the extant ruminants.Biological Reviews80(2):269‑302. https://doi.org/10.1017/s1464793104006670
-
Geographical variation in predictors of mammalian extinction risk: big is bad, but only in the tropics.Ecology Letters12(6):538‑549. https://doi.org/10.1111/j.1461-0248.2009.01307.x
-
Genus-level supertree of Cyprinidae (Actinopterygii: Cypriniformes), partitioned qualitative clade support and test of macro-evolutionary scenarios.Biological Reviews84(4):653‑689. https://doi.org/10.1111/j.1469-185x.2009.00091.x
-
TNT, a free program for phylogenetic analysis.Cladistics24(5):774‑786. https://doi.org/10.1111/j.1096-0031.2008.00217.x
-
Creative Commons licenses and the non-commercial condition: Implications for the re-use of biodiversity information.ZooKeys150:127‑149. https://doi.org/10.3897/zookeys.150.2189
-
The Supertree Toolkit 2: a new and improved software package with a Graphical User Interface for supertree construction.Biodiversity Data Journal2:e1053. https://doi.org/10.3897/bdj.2.e1053
-
Synthesis of phylogeny and taxonomy into a comprehensive tree of life.Proceedings of the National Academy of Sciences112(41):12764‑12769. https://doi.org/10.1073/pnas.1423041112
-
Threatened Reef Corals of the World.PLoS ONE7(3):e34459. https://doi.org/10.1371/journal.pone.0034459
-
TreeRipper web application: towards a fully automated optical tree recognition software.BMC Bioinformatics12(1):178. https://doi.org/10.1186/1471-2105-12-178
-
Phylogenetic Networks.Cambridge University Press,Cambridge (UK),376pp. [ISBN0748777962]
-
Dendroscope 3: An Interactive Tool for Rooted Phylogenetic Trees and Networks.Systematic Biology61(6):1061‑1067. https://doi.org/10.1093/sysbio/sys062
-
The Number of Scholarly Documents on the Public Web.PLoS ONE9(5):e93949. https://doi.org/10.1371/journal.pone.0093949
-
Quantitative Phyletics and the Evolution of Anurans.Systematic Zoology18(1):1. https://doi.org/10.2307/2412407
-
Timing of deep-sea adaptation in dogfish sharks: insights from a supertree of extinct and extant taxa.Zoologica Scripta39(4):331‑342. https://doi.org/10.1111/j.1463-6409.2010.00427.x
-
TreeSnatcher: coding trees from images.Bioinformatics23(24):3384‑3385. https://doi.org/10.1093/bioinformatics/btm438
-
TreeSnatcher plus: capturing phylogenetic trees from images.BMC Bioinformatics13(1):110. https://doi.org/10.1186/1471-2105-13-110
-
Dinosaurs and the Cretaceous Terrestrial Revolution.Proceedings. Biological sciences275(1650):2483‑90. https://doi.org/10.1098/rspb.2008.0715
-
Evolution of Philodendron (Araceae) species in Neotropical biomes.PeerJ4:e1744. https://doi.org/10.7717/peerj.1744
-
The Dawn of Open Access to Phylogenetic Data.PLoS ONE9(10):e110268. https://doi.org/10.1371/journal.pone.0110268
-
An updated paleontological timetree of lissamphibians, with comments on the anatomy of Jurassic crown-group salamanders (Urodela).Historical Biology26(4):535‑550. https://doi.org/10.1080/08912963.2013.797972
-
TreeRogue: R code for digitizing phylogenetic trees from published figures.0.21. URL: http://phylo.wikidot.com/treerogue
-
ASTRAL: genome-scale coalescent-based species tree estimation.Bioinformatics30(17):i541‑i548. https://doi.org/10.1093/bioinformatics/btu462
-
TreeBASE: The Roots of Phylogeny.Science273(5275):569. https://doi.org/10.1126/science.273.5275.569
-
Phylogenetic networks: modeling, reconstructibility, and accuracy.IEEE/ACM Transactions on Computational Biology and Bioinformatics1(1):13‑23. https://doi.org/10.1109/tcbb.2004.10
-
Comparative Cladistics: Fossils, Morphological Data Partitions and Lost Branches in the Fossil Tree of Life.University of Bath
-
ContentMine/ijsem: phylogenised.1.0. Release date:2017-3-29. URL: https://doi.org/10.5281/zenodo.439071
-
A Metric on the Space of Reduced Phylogenetic Networks.IEEE/ACM Transactions on Computational Biology and Bioinformatics7(2):218‑222. https://doi.org/10.1109/tcbb.2009.2
-
Updating the evolutionary history of Carnivora (Mammalia): a new species-level supertree complete with divergence time estimates.BMC Biology10(1):12. https://doi.org/10.1186/1741-7007-10-12
-
MorphoBank: phylophenomics in the “cloud”.Cladistics27(5):529‑537. https://doi.org/10.1111/j.1096-0031.2011.00355.x
-
Microbacterium ginsengisoli sp. nov., a -glucosidase-producing bacterium isolated from soil of a ginseng field.INTERNATIONAL JOURNAL OF SYSTEMATIC AND EVOLUTIONARY MICROBIOLOGY58(2):429‑433. https://doi.org/10.1099/ijs.0.65226-0
-
A complete phylogeny of the whales, dolphins and even-toed hoofed mammals (Cetartiodactyla).Biological Reviews80(03):445. https://doi.org/10.1017/s1464793105006743
-
TreeThief: a tool for manual phylogenetic tree entry.URL: http://evolve.zoo.ox.ac.uk/software/TreeThief/main.html
-
Taxamatch, an Algorithm for Near (‘Fuzzy’) Matching of Scientific Names in Taxonomic Databases.PLoS ONE9(9):e107510. https://doi.org/10.1371/journal.pone.0107510
-
Phylogenomic analysis supports a recent change in nitrate assimilation in the White-nose Syndrome pathogen, Pseudogymnoascus destructans.Fungal Ecology23:20‑29. https://doi.org/10.1016/j.funeco.2016.04.010
-
Comparison of phylogenetic trees.Mathematical Biosciences53:131‑147. https://doi.org/10.1016/0025-5564(81)90043-2
-
Troubleshooting Public Data Archiving: Suggestions to Increase Participation.PLoS Biology12(1):e1001779. https://doi.org/10.1371/journal.pbio.1001779
-
A supertree of Temnospondyli: cladogenetic patterns in the most species-rich group of early tetrapods.Proceedings of the Royal Society B: Biological Sciences274(1629):3087‑3095. https://doi.org/10.1098/rspb.2007.1250
-
. Ninth International Conference on Document Analysis and Recognition (ICDAR 2007) Vol 2https://doi.org/10.1109/icdar.2007.4376991
-
Sharing and re-use of phylogenetic trees (and associated data) to facilitate synthesis.BMC Research Notes5(1):574. https://doi.org/10.1186/1756-0500-5-574
-
Dynamics of dental evolution in ornithopod dinosaurs.Scientific Reports6(1): . https://doi.org/10.1038/srep28904
-
PAUP*. Phylogenetic analysis using parsimony (*and other methods).4.0b10.Sinauer Associates, Sunderland, MA.
-
Scholarly copyright: grotesque, pointless impediment, or fatuous waste of time and effort?https://svpow.com/2016/02/20/scholarly-copyright-grotesque-pointless-impediment-or-fatuous-waste-of-time-and-effort/. Accessed on: 2017-3-10.
-
Sparse Supermatrices for Phylogenetic Inference: Taxonomy, Alignment, Rogue Taxa, and the Phylogeny of Living Turtles.Systematic Biology59(1):42‑58. https://doi.org/10.1093/sysbio/syp075
-
The visual display of quantitative informations 2nd ed.Graphics Press,Cheshire, Conn.,197pp. [ISBN0961392142]
-
Online collaboration: Scientists and the social network.Nature512(7513):126‑129. https://doi.org/10.1038/512126a
-
The Availability of Research Data Declines Rapidly with Article Age.Current Biology24(1):94‑97. https://doi.org/10.1016/j.cub.2013.11.014
-
NeXML: Rich, Extensible, and Verifiable Representation of Comparative Data and Metadata.Systematic Biology61(4):675‑689. https://doi.org/10.1093/sysbio/sys025
-
The STM Report: An overview of scientific and scholarly journal publishing.STM: International Association of Scientific, Technical and Medical Publishers.
-
The poor availability of psychological research data for reanalysis.American Psychologist61(7):726‑728. https://doi.org/10.1037/0003-066x.61.7.726
-
The SILVA and “All-species Living Tree Project (LTP)” taxonomic frameworks.Nucleic Acids Research42:D643‑D648. https://doi.org/10.1093/nar/gkt1209
-
A fast parallel algorithm for thinning digital patterns.Communications of the ACM27(3):236‑239. https://doi.org/10.1145/357994.358023
Supplementary materials
A one-per-line UT8-encoded plain-text list of URLs of the 5816 source PDFs used in this research
Download file (309.52 kb)
The machine-readable text from the screenshot.
Download file (4.22 kb)