|
Research Ideas and Outcomes :
Project Report
|
|
Corresponding author: Camille Maumet (cmj.maumet@gmail.com)
Received: 22 Feb 2017 | Published: 24 Feb 2017
© 2017 Camille Maumet, Thomas Nichols
This is an open access article distributed under the terms of the Creative Commons Attribution License (CC BY 4.0), which permits unrestricted use, distribution, and reproduction in any medium, provided the original author and source are credited.
Citation:
Maumet C, Nichols T (2017) Generating and reporting peak and cluster tables for voxel-wise inference in FSL. Research Ideas and Outcomes 3: e12368. https://doi.org/10.3897/rio.3.e12368
|
|
Abstract
Mass universities analyses, in which a statistical test is performed at each voxel in the brain, is the most widespread approach to analyzing task-evoked functional Magnetic Resonance Imaging (fMRI) data. Such analyses identify the brain areas that are significantly activated in response to a given stimulus. In the literature, the significant areas are usually summarised by providing a table, listing, for each significant region, the 3D positions of the local maxima along with corresponding statistical values. This tabular output is provided by all the major as dsa dneuroimaging software packages including SPM, FSL and AFNI. Yet, in the HTML report generated by FSL, peak and cluster tables are only provided for one type of inference (cluster-wise inference) but not when a voxel-wise threshold is specified. In this project, we proposed an update for FSL to generate and report peak and cluster tables for voxel-wise inferences.
Keywords
fMRI, Mass univariate analyses, Results reporting
Introduction
Mass univariate analyses, in which a statistical test is performed at each voxel in the brain, is the most widespread approach to analyzing task-evoked functional Magnetic Resonance Imaging (fMRI) data. Such analyses identify the brain areas that are significantly activated in response to a given stimulus. In the literature, the significant areas are usually summarised by providing a table listing, for each significant region (also known as "cluster"), the 3D positions of the local maxima (also known as "peaks") along with corresponding statistical values. This tabular output is provided by all the major neuroimaging software packages including Statistical Parametric Mapping (SPM
Yet, in the HTML report generated by FSL, peak and cluster tables are only provided for one type of inference (cluster-wise inference) but not when a voxel-wise threshold is specified. The goal of this project was to extend the functionalites of FSL to generate and report peak and cluster tables for voxel-wise inference.
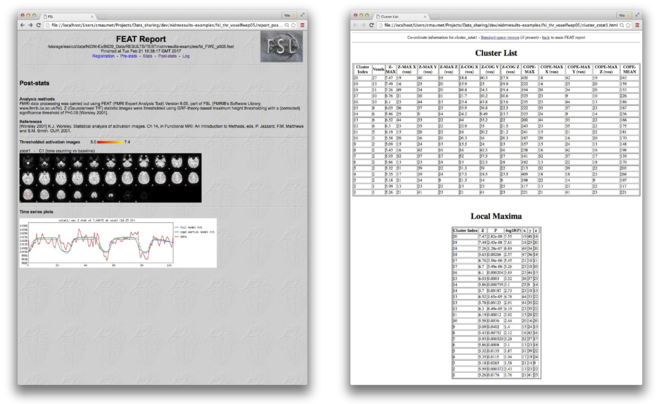
As part of its outputs, FSL FEAT generates an HTML result page for each contrast of interest (e.g. “cluster_zstat1.html”) which includes two tables. The first table provides a list of the significant clusters with their size in voxels; the cluster p-value, -log10(p-value), equivalent z-statistic and x, y, z coordinates of the voxel with the maximum statistic value as well as the estimated contrast value and the x, y, z coordinates of the voxel with the maximum contrast estimate. The second table provides a list of equivalent z-statistics and x, y, z coordinates for each peak in each cluster. Both tables are stored as text files (e.g. cluster table in " cluster_zstat1.txt" and peak table in "lmax_zstat1.txt"). Coordinates (x, y, z) are provided both in voxel space (e.g. “cluster_zstat1.html”) and standardised world space (e.g. “cluster_zstat1_std.html”) for first-level analyses and in standardised world space only for higher-level analyses (e.g. “cluster_zstat1_std.html”).
Approach
First, we updated and refactored the FSL core "ztop" utility to generate p-values for corrected and uncorrected voxel-wise statistics. "ztop" is a command line tool which returns the p-value corresponding to an input z-statistic value. We extended “ztop” with a “-g” option which can be used to input the volume of the search space in resels in which case the command returns an FWE-corrected p-value (estimated using random field theory) rather than an uncorrected p-value (default). The computation of corrected and uncorrected p-values from z-statistic was extracted as a function so that it could easily be re-used (the "ztop" command line tool uses the "ztop_function").
Second, we updated the FSL core “cluster” class which creates the cluster and peak tables and saves them as text files (e.g. “lmax_zstat1.txt” and “cluster_zstat1.txt”). We added two new options for corrected (“--voxthresh”) and uncorrected (“--voxuncthresh”) voxel-wise thresholds and added calls to the “ztop_functoin” function where necessary to deal with these new options.
Finally, we updated “featlib.tcl” to add the relevant calls to the “cluster” command when voxel-wise thresholds are used. "featlib.tcl" is the main script to run the fMRI analysis from pre-processing to the generation of the HTML results page using FEAT in FSL.
We performed a series of tests to check that fMRI analyses performed with FEAT could run without error on a set of studies that were designed to cover major fMRI use cases (
Results
The proposed update for FSL is publically available at https://github.com/cmaumet/fsl (cf. pull request 3 and 5). The datasets that were used for testing are available at https://github.com/incf-nidash/nidmresults-examples/ (cf. pull request 97).
Fig.
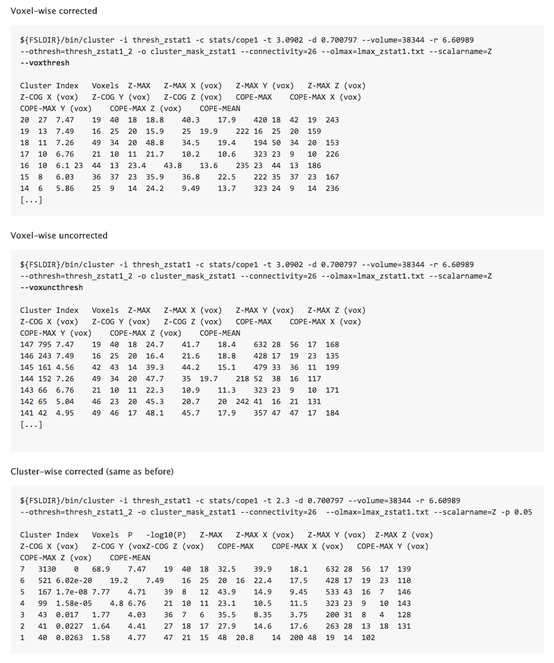
Fig.
Conclusion
We have provided an update to generate tables of peaks and clusters for voxel-wise inference in FSL. This extension will be useful in the development of standardised exports for results of task-based fMRI studies (e.g.
Author’s contributions
TEN updated the "ztop" function and provided guidance in the update of the "cluster" class. CM performed the rest of the implementation and wrote the report.
Acknowledgements
The authors would like to thank the organizers and attendees of the 2016 OHBM Hackathon. We also gratefully acknowledge Mark Jenkinson, Matthew Webster and Paul Mccarthy from FMRIB for their feedback and support. CM and TEN were supported by the Wellcome Trust.
References
- AFNI: Software for Analysis and Visualization of Functional Magnetic Resonance Neuroimages.Computers and Biomedical Research29(3):162‑173. https://doi.org/10.1006/cbmr.1996.0014
- FSL.NeuroImage62(2):782‑790. https://doi.org/10.1016/j.neuroimage.2011.09.015
- Sharing brain mapping statistical results with the neuroimaging data model.Scientific Data3:160102. https://doi.org/10.1038/sdata.2016.102
- Exploring fMRI Results Space: 31 Variants of an fMRI Analysis in AFNI, FSL, and SPM.Frontiers in Neuroinformatics10https://doi.org/10.3389/fninf.2016.00024
- Statistical parametric mapping: the analysis of functional brain images.Academic press