|
Research Ideas and Outcomes : Project Report
|
|
Corresponding author: Christopher R Madan (madanc@bc.edu)
Received: 14 Feb 2017 | Published: 15 Feb 2017
© 2017 Anisha Keshavan, Christopher Madan, Esha Datta, Ian McDonough
This is an open access article distributed under the terms of the Creative Commons Attribution License (CC BY 4.0), which permits unrestricted use, distribution, and reproduction in any medium, provided the original author and source are credited.
Citation: Keshavan A, Madan CR, Datta E, McDonough IM (2017) Mindcontrol: Organize, quality control, annotate, edit, and collaborate on neuroimaging processing results. Research Ideas and Outcomes 3: e12276. https://doi.org/10.3897/rio.3.e12276
|

|
Abstract
Mindcontrol is an open-source web-based dashboard to quality control and curate neuroimaging data. At Neurohackweek 2016, a group assembled to add new features to the Mindcontrol interface. Contributors used Python, Javascript, and Git to configure Mindcontrol for the ABIDE and CoRR open datasets, and add new types of plots to the interface. All contributions are freely available online, and the code is being actively maintained at http://www.github.com/akeshavan/mindcontrol.
Keywords
Brain, Interactive, Visualization, Curation, Segmentation
What is Mindcontrol?
Mindcontrol is a web-based application that consists of a dashboard to organize, quality control, annotate, edit, and collaborate on neuroimaging processing results (
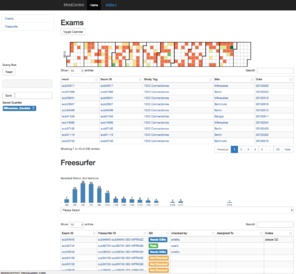
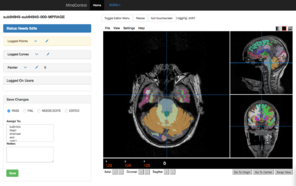
The original Mindcontrol application is shown here. On the left is the dashboard view, with a calendar heatmap plot of exam dates at the top, and a histogram of 3rd-Ventricle volumes from Freesurfer. Clicking on the "Freesurfer id" of an exam in the lower tables opens the view on the right, where users can annotate points, curves, and edit the volume of the freesurfer segmentation.
Progress at Neurohackweek
At Neurohackweek 2016, we expanded on mindcontrol to add additional functionality. The current build of mindcontrol had been tailored to particular use cases as was initially needed, however one of our goals was to expand the architecture to increase the flexibility of mindcontrol for use cases beyond the initial development.
Importing data sources and linking with open-access datasets
Creating the initialization JSON for the mindcontrol database is a critical step for deployment within a specific research laboratory. To both facilitate this need, as well as provide easy quality control metrics of open-access datasets, we worked on importing data from two open-access datasets, CoRR (Consortium for Reliability and Reproducibility) (
CoRR: http://fcon_1000.projects.nitrc.org/indi/CoRR/html/
ABIDE Preprocessed: http://preprocessed-connectomes-project.org/abide/
Progress made during Neurohackweek 2016: CoRR
The CoRR dataset is longitudinal and includes data acquired from the same subjects at several time points. From this dataset, we extracted a subset of quality control measures (Signal to Noise Ratio (SNR), Contrast to Noise Ratio (CNR), entropy focus criterion, foreground to background energy ratio, percent artifact voxels, and spatial smoothness) from the anatomical scans. This data was input into a JSON file that was then used to initialize mindcontrol.
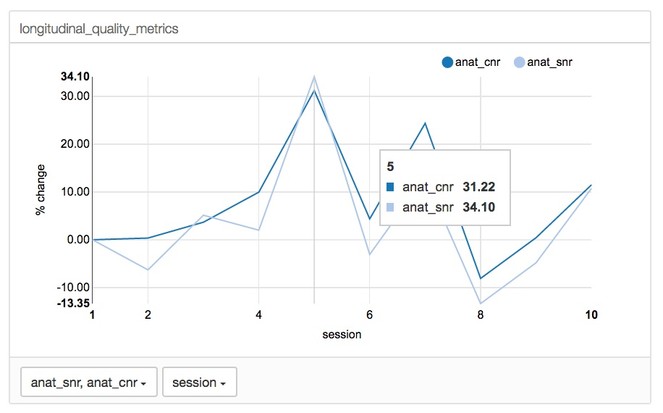
A line graph function was implemented to allow the user to visualize how metrics change across time in longitudinal data (see Fig.
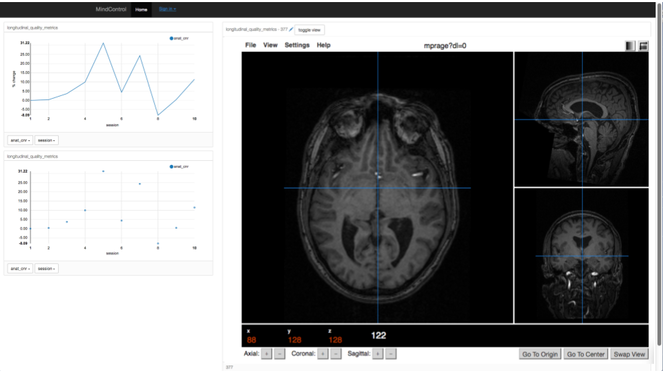
The longitudinal view of a single subject and their quality metrics over time. Clicking on a point on the plots on the left-hand side loads the correponding image on the right.
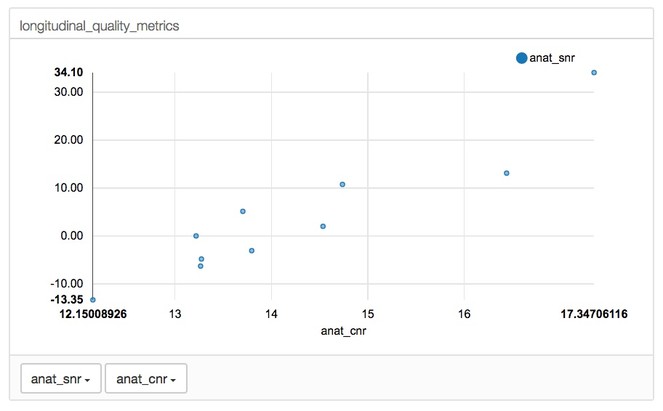
Example of scatterplot function to display the relationship of metrics in longitudinal data
Progress made during Neurohackweek 2016: ABIDE
First, structural MRI and functional MRI quality control measures were extracted from the ABIDE dataset and entered in a matrix. This matrix was then used to create a JSON file to initialize the ABIDE branch of the mindcontrol software. The same was done for pre-calculated estimates of brain volume and cortical thickness from the ABIDE dataset. With this addition, multiple data sets can be viewed and compared on various brain metrics. Doing so aids in the collection of normative data that various across institutions and people.
Second, a scatterplot function was implemented to probe how various quality control measures might relate to each other. The ABIDE data set includes about 4 dozen quality control metrics (http://preprocessed-connectomes-project.org/quality-assessment-protocol/) across both brain structure and function. The added scatterplot function allows investigators to investigate whether the quality of one metric influences another both within modalities (structure-to-structure) and between modalities (structure-to-function). For example, one can test the extent that the Foreground to Background Energy Ratio (FBER) within a structural scan is related to the Contrast to Noise Ratio (CNR) within a structural scan (see Fig.
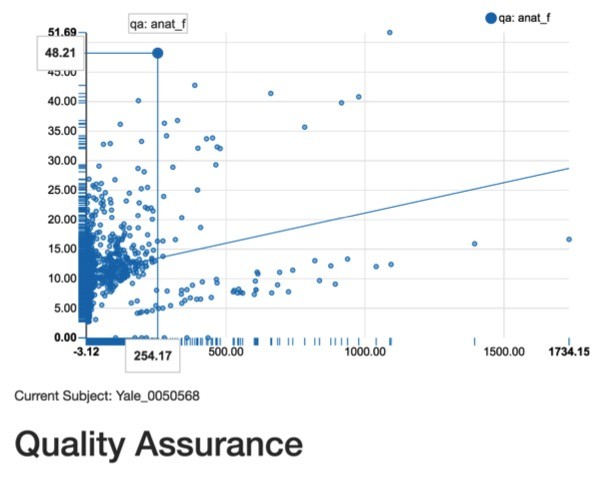
Example of new scatterplot function. Structural Foreground to Background Energy Ratio is positively related with Structural Contrast to Noise Ratio. Single data points can also be highlighted to detect outlers.
The original version of mindcontrol offered a graphical histogram to detect outliers for a selected measure. Histograms are very useful for detecting outlying values for a given subject. However, sometimes a value might be appropriately "low" or "high" and appear to be an outlier, when it is not. For this reason, a complementary approach to data quality control is to compare hemisphere differences within each subject for a given region. While small hemispheric differences are expected, large differences either mark severe pathology or a processing error. Towards this aim, the scatterplot function also was used to dynamically display the left hemisphere value on the x-axis and the right hemisphere in the y-axis when selecting a region. By clicking a data point, a field below the scatterplot will indicate the subject code for the person.
Surface viewer
Another focus of development at neurohackweek was to streamline an existing web-based surface viewer, BrainBrowser (
Conclusion
The improvements to Mindcontrol during Neurohackweek 2016 enables users to easily reconfigure Mindcontrol for specific use cases, add new information visualizations to the interface, and add new medical image visualizations to the platform. We hope to build an active open-source community around Mindcontrol to add new features to the platform and make brain quality control more efficient and collaborative.
Acknowledgements
The authors would like to thank Ariel Rokem for organizing Neurohackweek, and Cameron Craddock for his assistance with the ABIDE and CoRR datasets. C.R.M. was supported by a fellowship from the Canadian Institutes of Health Research (FRN-146793).
References
-
The autism brain imaging data exchange: towards a large-scale evaluation of the intrinsic brain architecture in autism.Molecular psychiatry19(6):659‑67. https://doi.org/10.1038/mp.2013.78
-
Mindcontrol: A Web Application for Brain Segmentation Quality Control.biorxivhttps://doi.org/10.1101/090431
-
BrainBrowser: distributed, web-based neurological data visualization.Frontiers in Neuroinformatics8:89. https://doi.org/10.3389/fninf.2014.00089
-
An open science resource for establishing reliability and reproducibility in functional connectomics.Scientific Data1:140049. https://doi.org/10.1038/sdata.2014.49