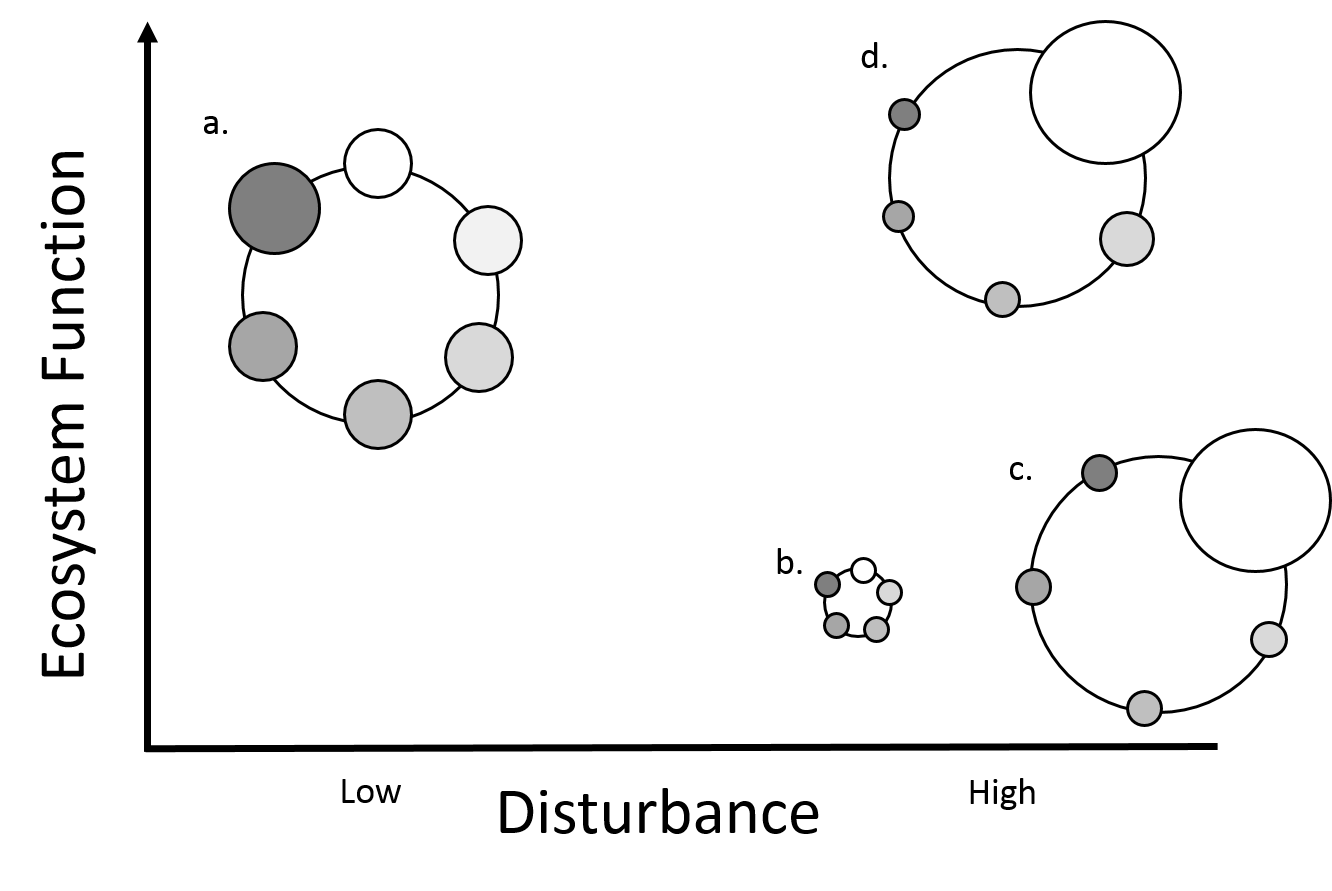
Figure 2: The hypothetical changes in community composition as a result of changes in the disturbance across sites and their potential impact on ecosystem function. The X-axis shows two states of disturbance, ‘low’ (a baseline/reference) and ‘high’ (a change in the disturbance, such as a non-natural land use). Y-axis shows the potential amount or rate of an unspecified ecosystem function provided by the community. Each large circle is a community, composed of multiple smaller circles of different taxa groups (e.g. earthworms, carabid beetles, millipedes etc.) The size of the smaller circles indicates abundance or biomass of that group. The community changes from the reference state (a) when the disturbance changes (b, c, d). The community could change in equal proportions (b) or in dominance structure (c and d). The changes could result in a reduction in the ecosystem function that the community provides (b and c) or the ecosystem function could be maintained (d), especially if the dominant group is the main contributor to the ecosystem function measured.