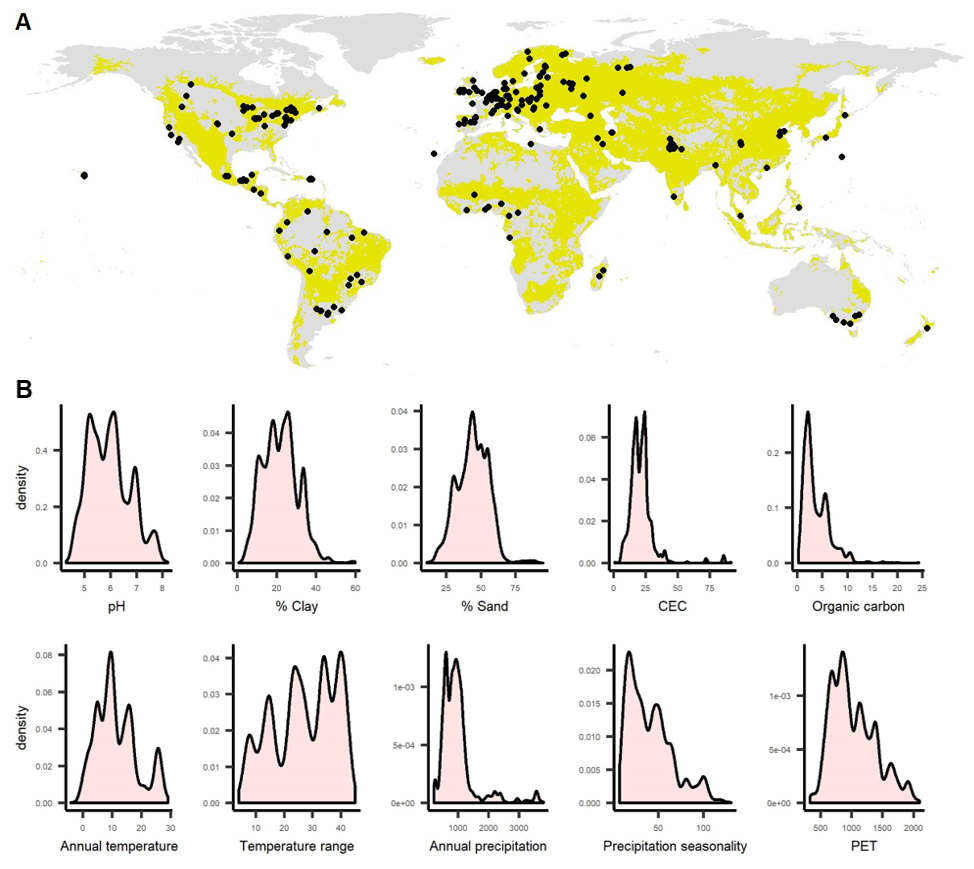
Figure 1: A) Black dots show sample locations of the 11,009 sites in the Phillips et al. 2019) data. Yellow indicates areas where climate change is predicted to be greatest (> 3 degrees C change in temperature or a change of absolute 100 mm in rainfall; using Karger et al. 2017 and are relatively accessible from settlements (< 12 hours travel time; using Weiss et al. 2018). Apart from western Europe, most regions with a lot of climate change are not sampled representatively. B) Environmental representation of the current database across 10 environmental variables. Coverage is typically well spread, but under-representing certain values.

 
  Part of: Phillips HRP, Cameron EK, Eisenhauer N (2022) Illuminating biodiversity changes in the ‘Black Box’. Research Ideas and Outcomes 8: e87143. https://doi.org/10.3897/rio.8.e87143