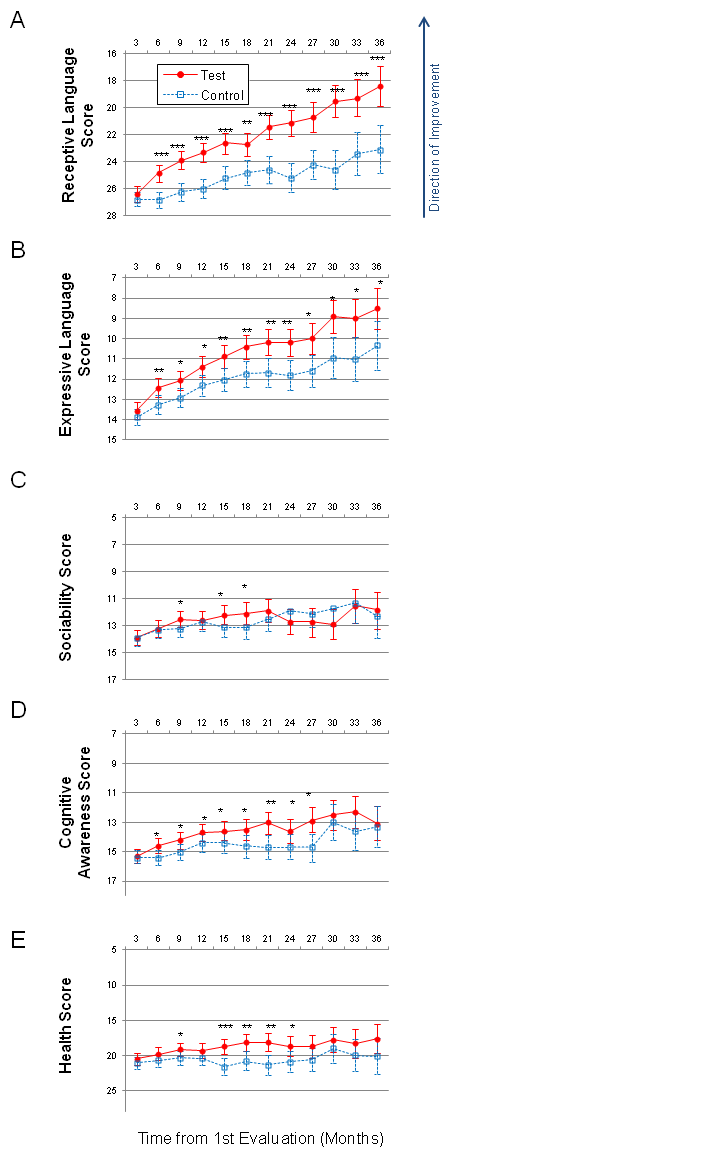
Longitudinal plots of subscale scores LS Means. Horizontal axis shows months from the 1st evaluation (0 to 36 months). Error bars set at 95% confidence interval. To facilitate comparison between subscales, all vertical axes ranges have been normalised to show 35% of their corresponding subscale’s maximum available score. A lower score indicates symptoms improvement. P-value is marked: ***< 0.0001; **< 0.001; *< 0.05. (A) Receptive Language score. (B) Expressive Language score. (C) Sociability score. (D) Cognitive awareness score. (E) Health score. The test group included study participants who completed more than one thousand PFS exercises and made no more than one error per exercise. The control group was selected from the rest of participants by a matching procedure. Each test group participant was matched to the control group participant by age, gender, expressive language, receptive language, sociability, cognitive awareness and health score at 1st evaluation using propensity score analysis. The complete methods and the discussion of results can be found in