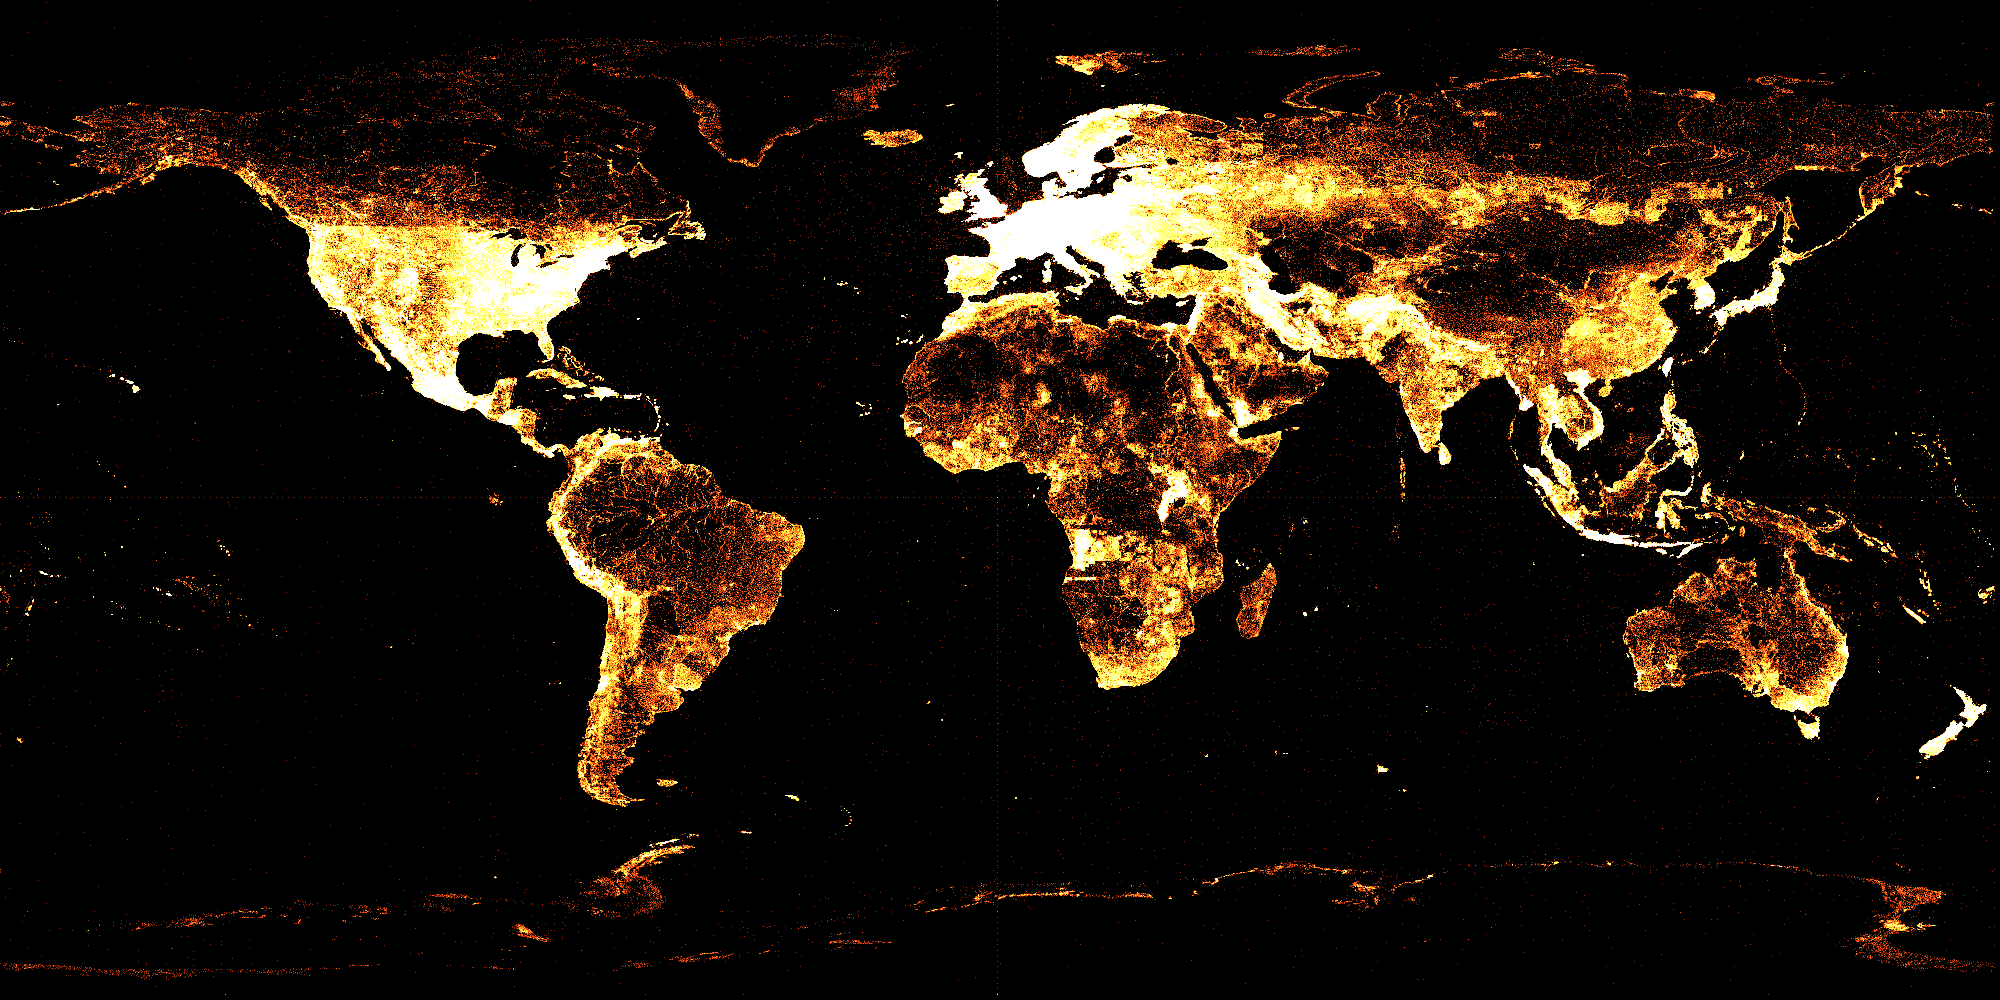
Map of geographical bias in Wikidata (by Adam Shoreland, via Wikimedia Commons, CC0). The color indicates how many Wikidata items have a geolocation within the corresponding pixel, with brighter colors indicating a larger number. The observed biases are a combination of multiple factors, including human settlement patterns and Internet access. In a similar fashion, Wikidata can be used to visualize other kinds of biases, across data types, domains of knowledge, or historic eras.