|
|
||
|
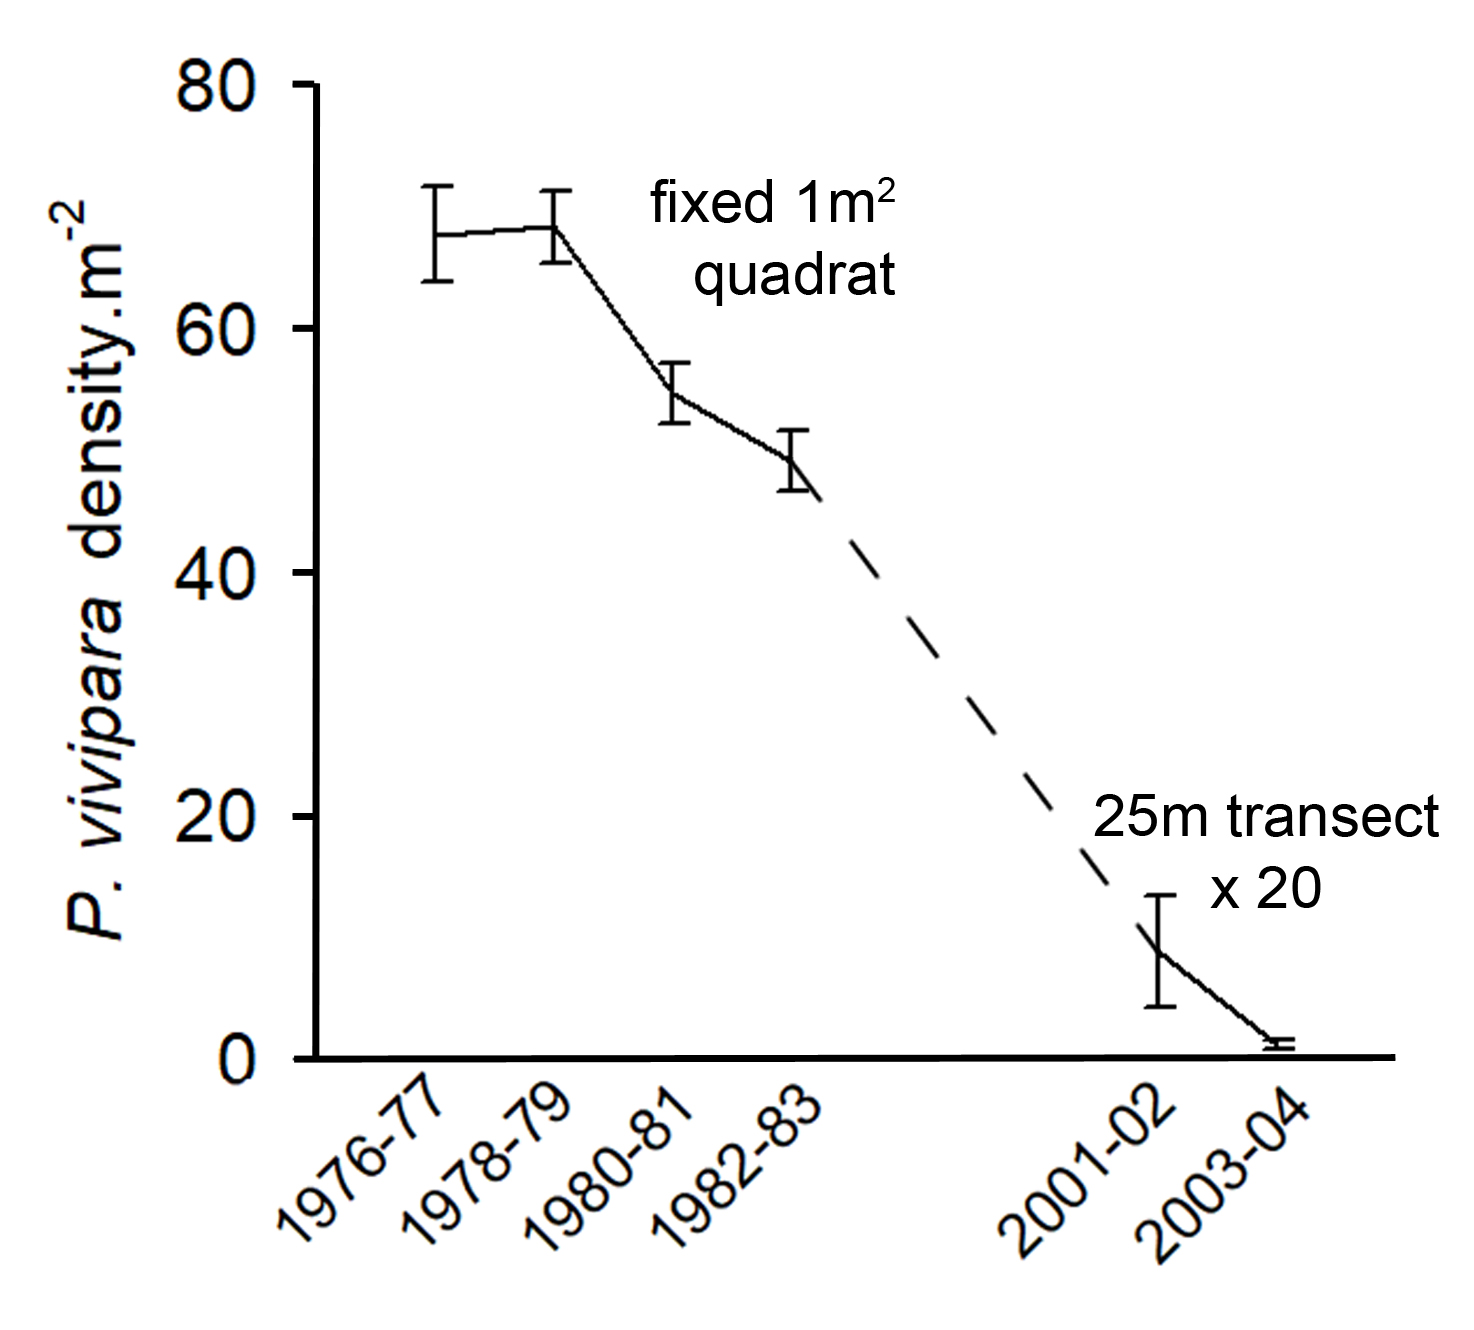
Trends from the largest P. vivipara population at Pitt Water. Each point is the mean of adult densities from numerous sampling events over each 2 year period. During 1976-83 a fixed 1 m2 quadrat was sampled ( |
||
| Part of: Liversage K, Byrne M (2018) A note on life-history traits and conservation concerns for viviparous Australian seastars (Parvulastra parvivipara and P. vivipara). Research Ideas and Outcomes 4: e29766. https://doi.org/10.3897/rio.4.e29766 |