|
|
||
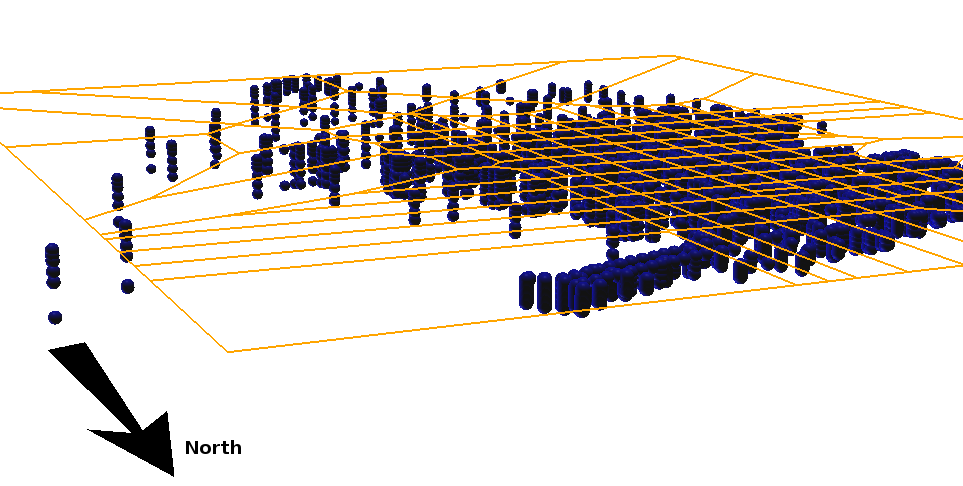
| 3D visualization of data from the viewpoint in b: the yellow grid represents the sea level, each set of vertical points represents more samplings relying on the same (X, Y) coordinates but at different depths (Z) | ||
| Part of: Minelli A, Oggioni A, Pugnetti A, Sarretta A, Bastianini M, Bergami C, Bernardi Aubry F, Camatti E, Scovacricchi T, Socal G (2018) The project EcoNAOS: vision and practice towards an open approach in the Northern Adriatic Sea ecological observatory. Research Ideas and Outcomes 4: e24224. https://doi.org/10.3897/rio.4.e24224 |