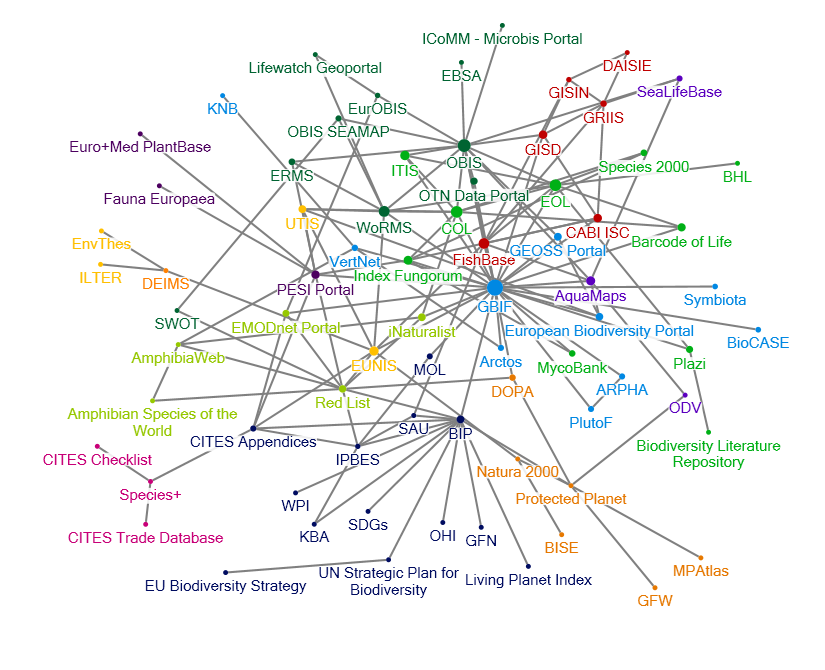
The network of biodiversity informatics organisations. The network visualisation was created using NodeXL (Version 1.0.1.229) (
|
|
||
|
The network of biodiversity informatics organisations. The network visualisation was created using NodeXL (Version 1.0.1.229) ( |
||
| Part of: Bingham H, Doudin M, Weatherdon L, Despot-Belmonte K, Wetzel F, Groom Q, Lewis E, Regan E, Appeltans W, Güntsch A, Mergen P, Agosti D, Penev L, Hoffmann A, Saarenmaa H, Geller G, Kim K, Kim H, Archambeau A, Häuser C, Schmeller D, Geijzendorffer I, García Camacho A, Guerra C, Robertson T, Runnel V, Valland N, Martin C (2017) The Biodiversity Informatics Landscape: Elements, Connections and Opportunities. Research Ideas and Outcomes 3: e14059. https://doi.org/10.3897/rio.3.e14059 |