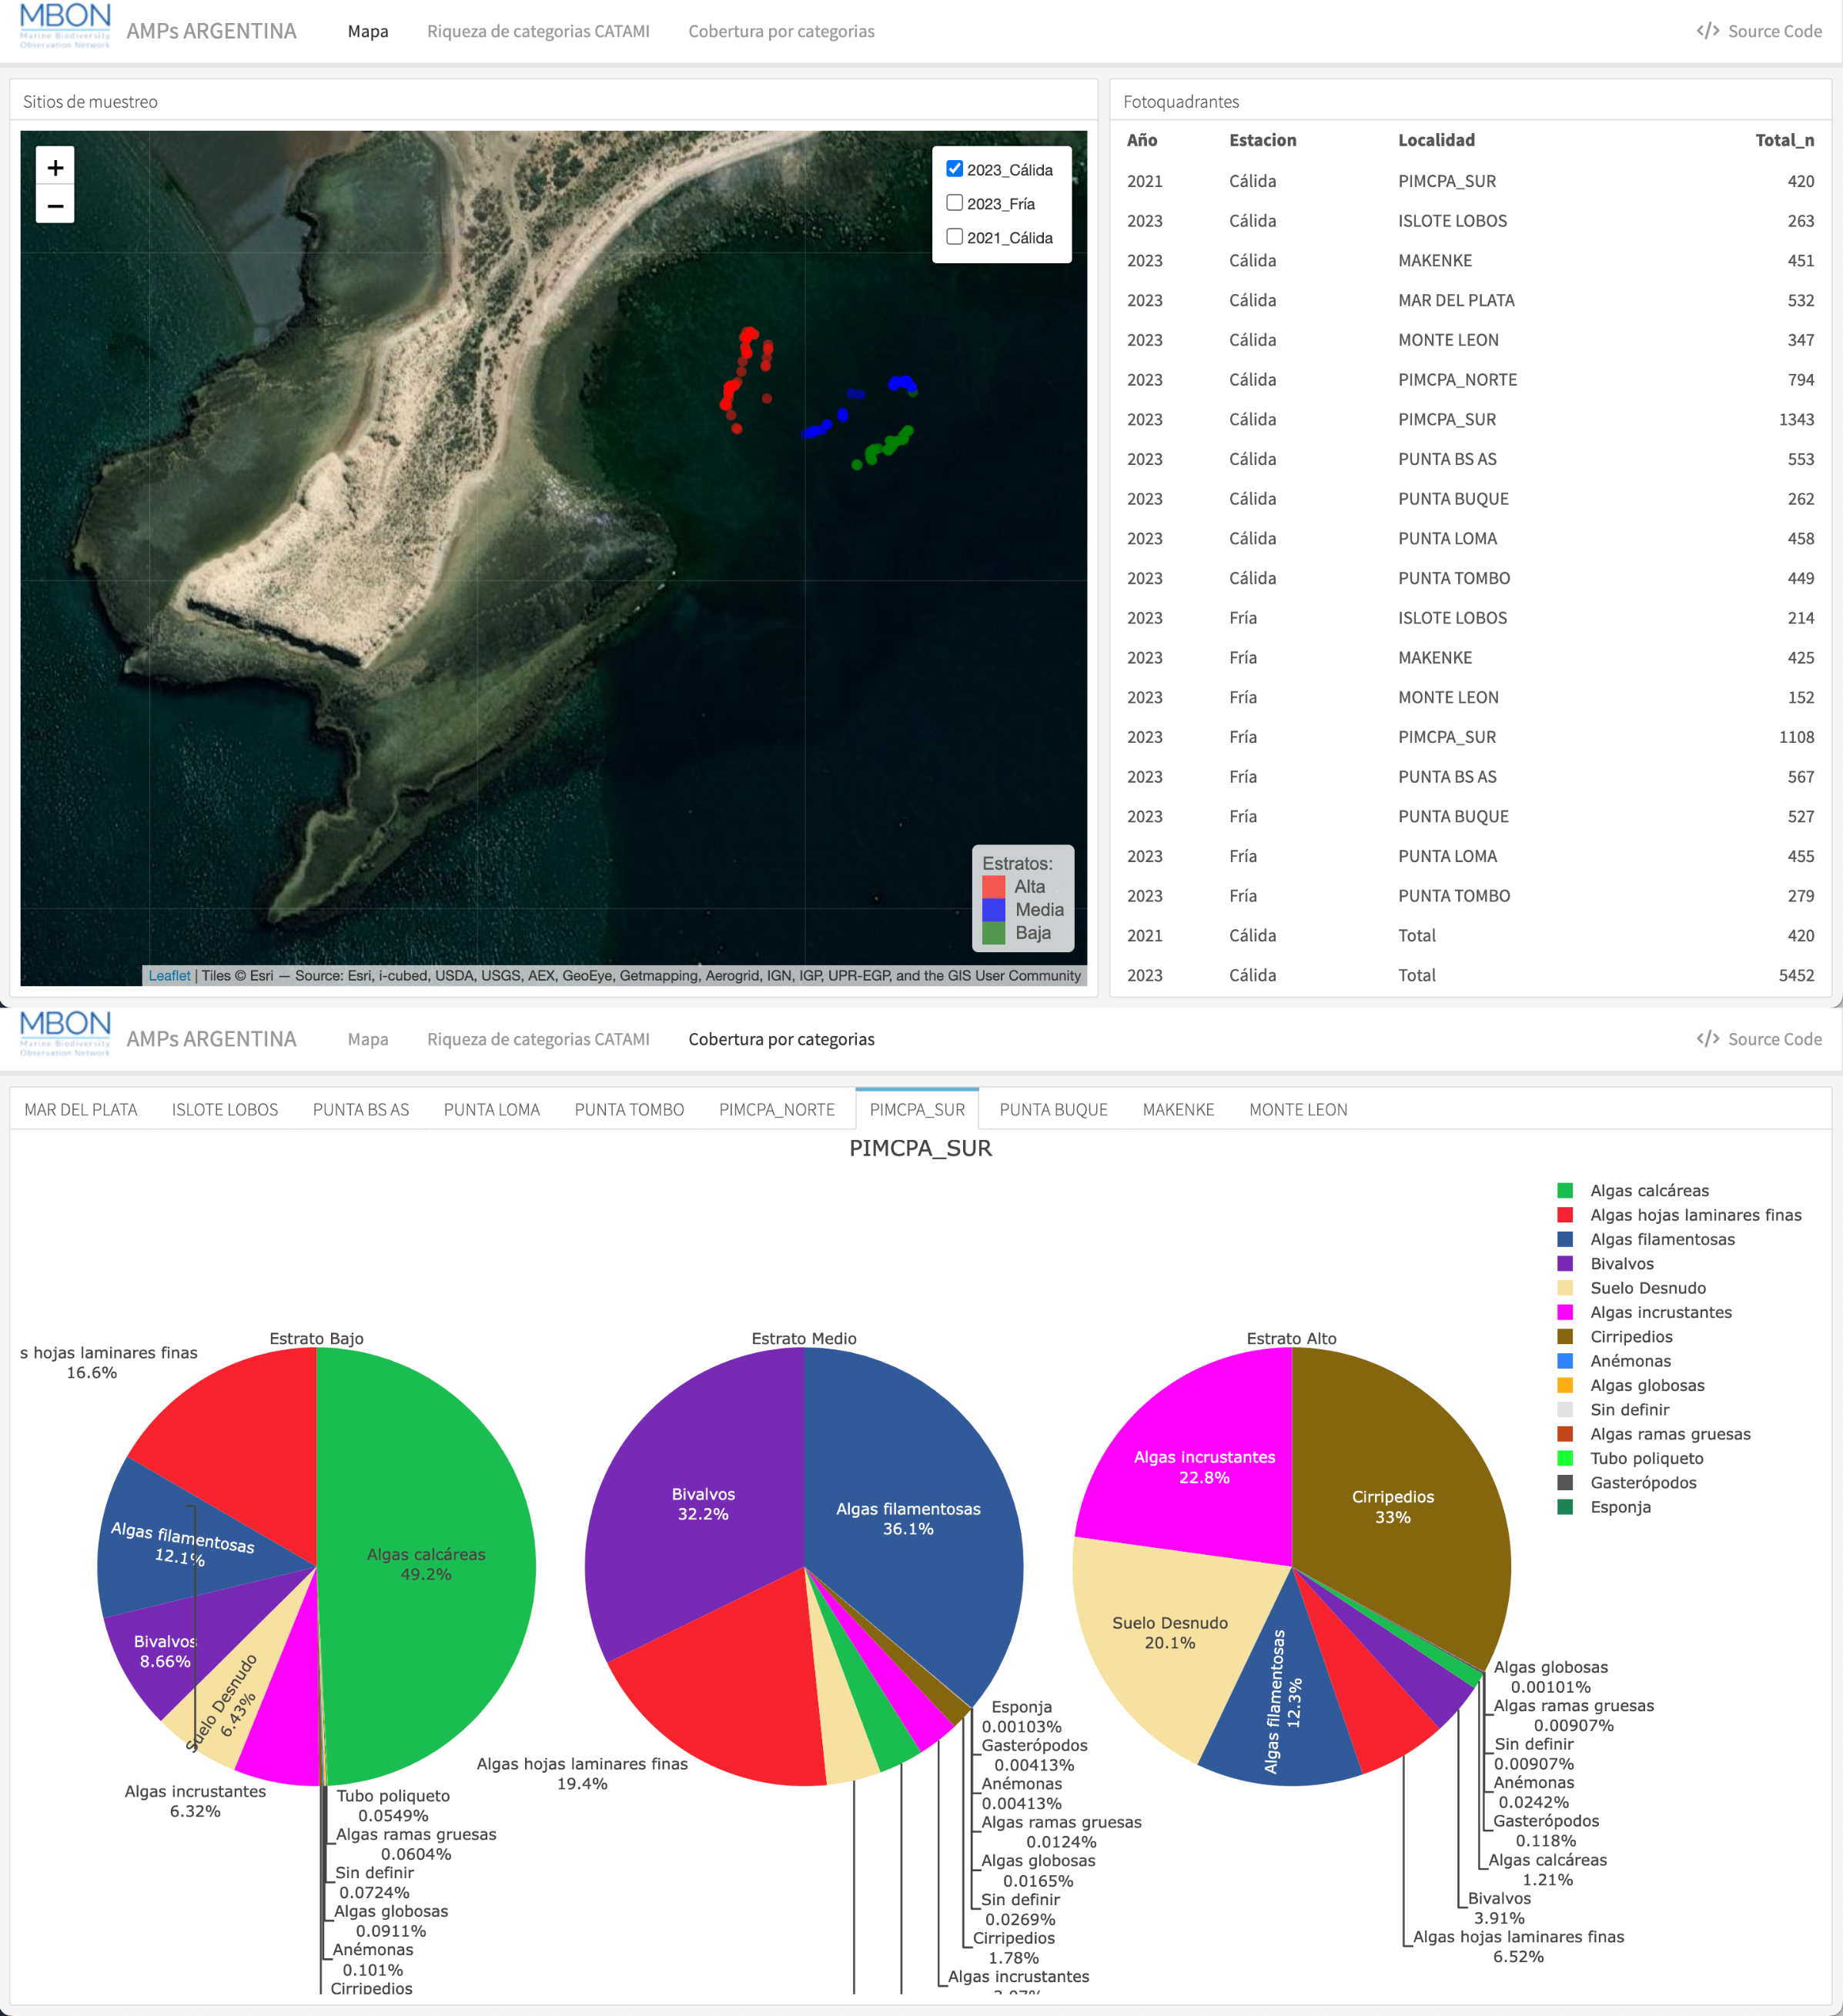
Dashboard created using R Markdown for synthesis and visualisation of collected data, enabling users to consult the GPS position of each photo-quadrat on the map and percentage cover estimates of CATAMI groups in each sampled area. This interactive tool enables comprehensive analysis and interpretation of gathered information.

 
  Part of: Bravo G, Bigatti G, Bagur M, Macaya EC, Valdivia N, Rodriguez A, Gauna M, Walker I, Livore JP, Mendez MM, Nieto Vilela R, Lima FP, Seabra R, Montes E (2024) Implementing biodiversity monitoring of rocky shores using photo-quadrats and Artificial Intelligence in support of data-driven decision-making of marine living resources. Research Ideas and Outcomes 10: e126660. https://doi.org/10.3897/rio.10.e126660