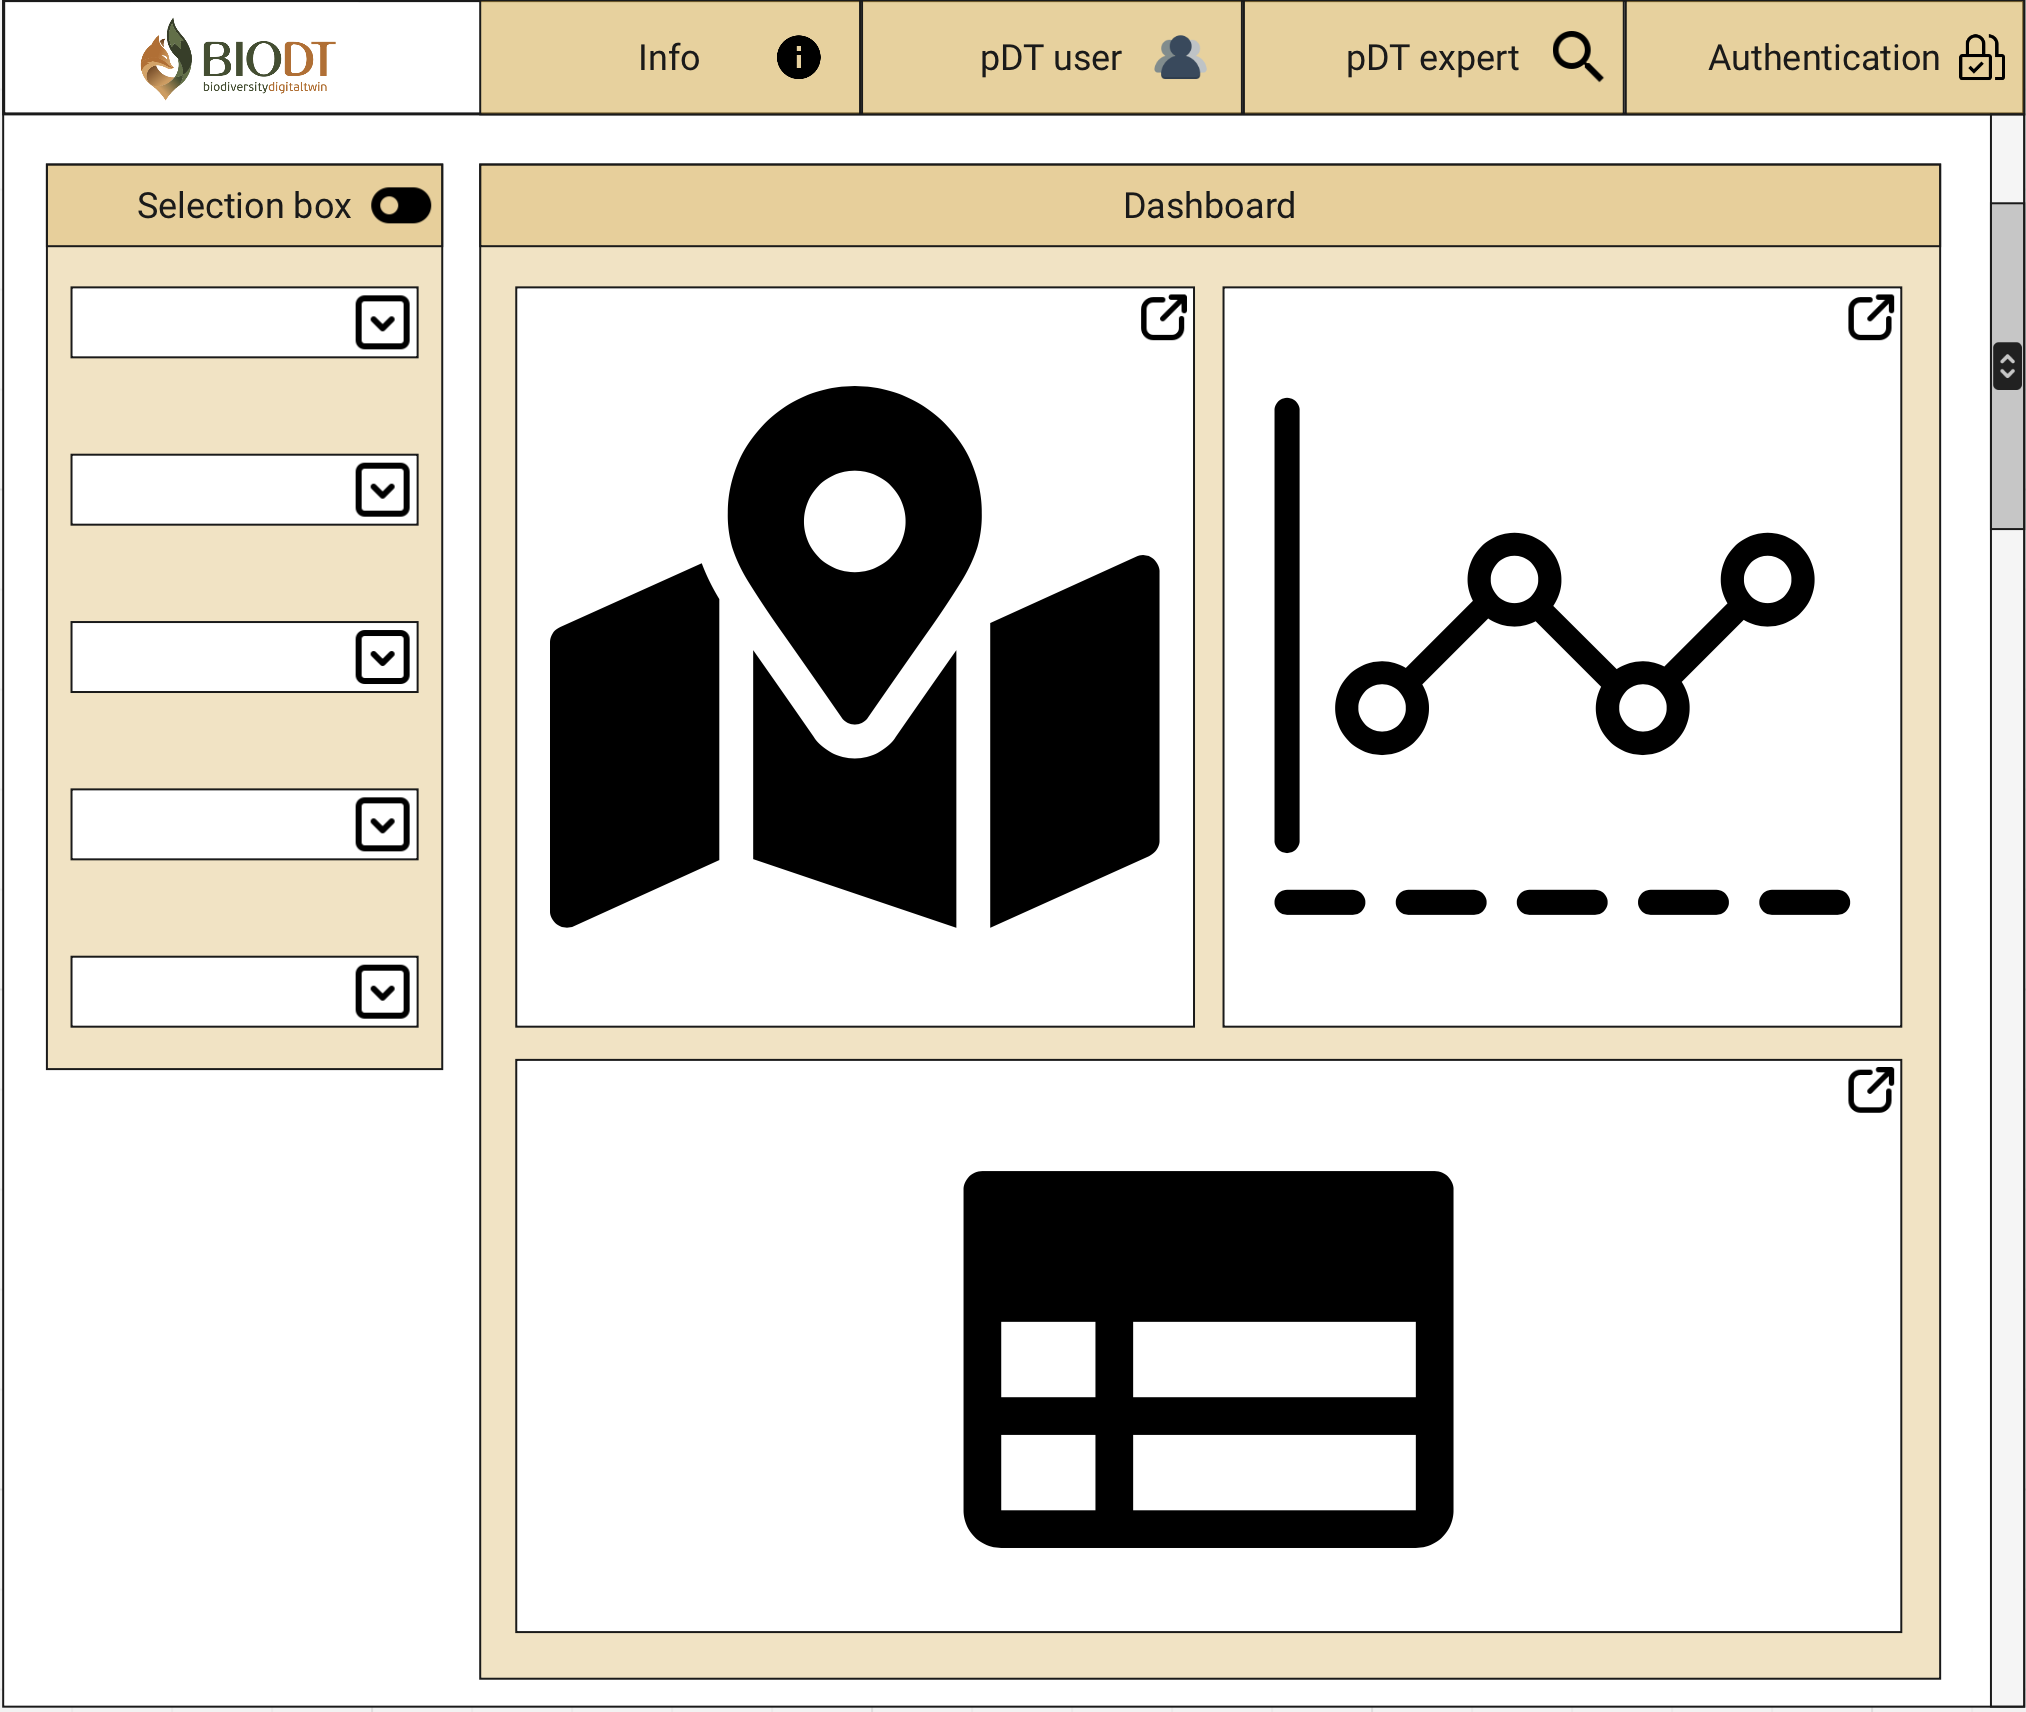
Figure 4. Wireframe of the IAS pDT dashboard, displaying the envisioned features of the web application (as it was not ready at the time of writing), including the tabs containing the information on the pDT, the user group (pDT user and pDT expert) and user authentication. The web application will have selection boxes (on the left) and a dashboard (on the centre-right) displaying dynamically updated maps, graphs and tables.