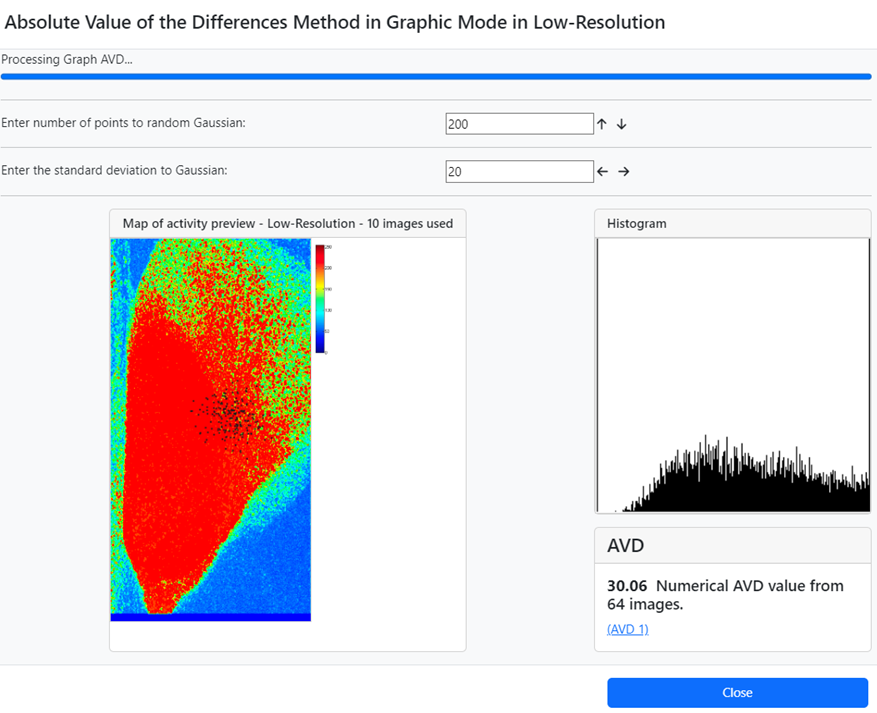
Crop image of the Online Analysis screen with the preview in low resolution of a corn seed map of activity, the collection of points (in black) in the area where the user wants to know the numerical activity presented by the AVD index. The histogram of the points is also presented to help the user evaluate saturation or under-exposure of the area selected to provide the numerical analysis.