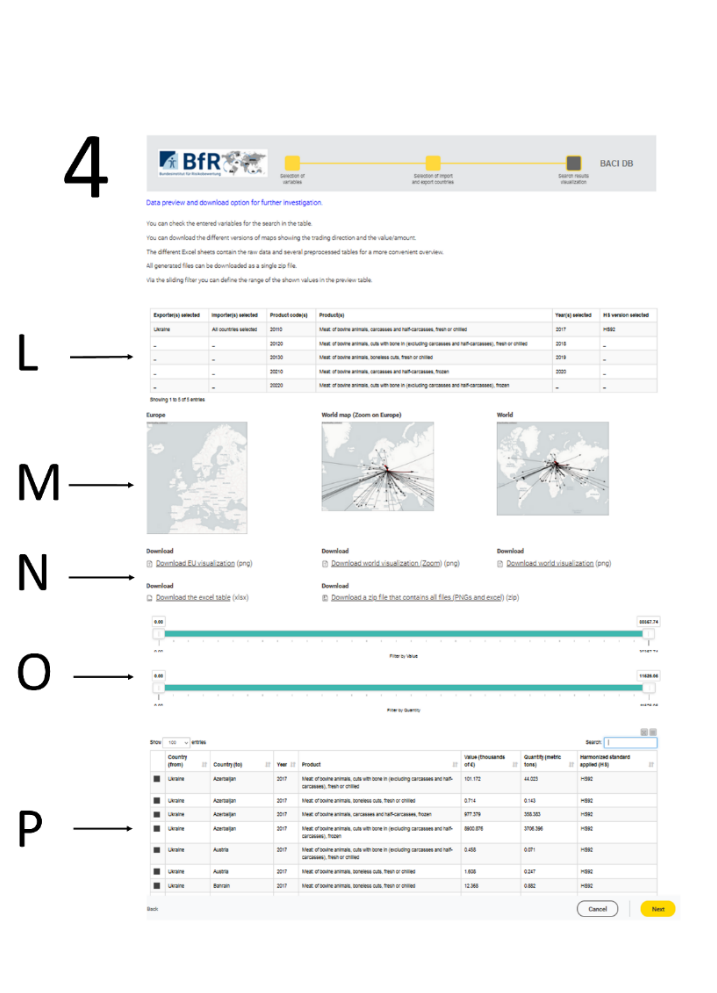
WI User Interfaces: UI4. The UI4 provides an overview of the final WI outputs, displaying a list with the initial input variables (L), three maps displaying trade flows (a world map, a world map focused on Europe and an European map) (M), download options (N), slide filter bars for value and weight preview (O) and trade flow data in the preview table (P).