|
Research Ideas and Outcomes : Research Poster
|
|
Corresponding author: Andrey Vyshedskiy (vysha@bu.edu)
Received: 11 May 2016 | Published: 11 May 2016
© 2016 Andrey Vyshedskiy, Raymond Murphy.
This is an open access article distributed under the terms of the Creative Commons Attribution License (CC BY 4.0), which permits unrestricted use, distribution, and reproduction in any medium, provided the original author and source are credited.
Citation: Vyshedskiy A, Murphy R (2016) Acoustic biomarkers of Chronic Obstructive Lung Disease. Research Ideas and Outcomes 2: e9173. doi: 10.3897/rio.2.e9173
|

|
Abstract
Background
Computerized lung sound analysis offers the promise of providing information that can help in noninvasive diagnosis and monitoring of cardiopulmonary disorders. The goal of this study was to determine whether differences existed in the computerized sounds of patients with Chronic Obstructive Pulmonary Disease (COPD) that distinguished them from age-matched controls.
New information
We used a multichannel lung sound analyzer that provides acoustic data from multiple sites on the chest wall to study 90 patients diagnosed by their physicians as having COPD. Their findings were compared to 90 age matched controls who presented themselves to an internist for their annual physical examination. We calculated over 100 parameters for each subject. Eleven parameters of these parameters were statistically different between COPD and control patients: Inspiratory and expiratory crackle rate as well as inspiratory and expiratory wheeze/rhonchi rate was greater in COPD. Ratio of the duration of inspiration to the duration of expiration was smaller in COPD. Ratio of peak inspiratory amplitude to peak expiratory amplitude was smaller in COPD. Ratio of low frequency inspiratory energy to high frequency inspiratory energy was increased in COPD. Lead - the difference in timing between the start of inspiration at the trachea and the start of inspiration at each chest wall site, and lag - the difference in timing between the end of inspiration at the trachea and the end of inspiration at each chest wall site as well as lead and lag time-integrated amplitude was increased in COPD.
This study showed that measurable differences exist between the lung sound patterns of Chronic Obstructive Pulmonary Disease patients as compared to age-matched controls.
Keywords
STG16, lung sounds, multichannel lung sound, COPD
Introduction
The goal of this study was to determine lung sounds-derived biomarkers that distinguished Chronic Obstructive Pulmonary Disease patients from age-matched controls. We quantified time and frequency based acoustic parameters using multiple microphones placed on the chest surface.
Methods
We used a multichannel lung sound analyzer to study 90 patients diagnosed by their physicians as having Chronic Obstructive Pulmonary Disease. The acoustic findings in these patients were compared to those in 90 age matched controls who presented to an internist for an annual physical examination. We calculated over 100 parameters for each subject. Eleven parameters were statistically different between COPD and control patients:
- Ratio of the duration of inspiration to the duration of expiration (%)
- Lead - the difference in timing between the start of inspiration at the trachea and the start of inspiration at each chest wall site (% of inspiration duration)
- Lag - the difference in timing between the end of inspiration at the trachea and the end of inspiration at each chest wall site (% of inspiration duration)
- Lead time-integrated amplitude (a.u.)
- Lag time-integrated amplitude (a.u.)
- Maximum ratio of low frequency energy (between 10Hz and 80Hz) to high frequency energy (80Hz to 500Hz) among chest microphones
- Inspiratory crackle rate
- Expiratory crackle rate
- Inspiratory wheeze and rhonchi rate
- Expiratory wheeze and rhonchi rate
- Ratio of peak inspiratory amplitude to peak expiratory amplitude
The eleven parameters are further explained in
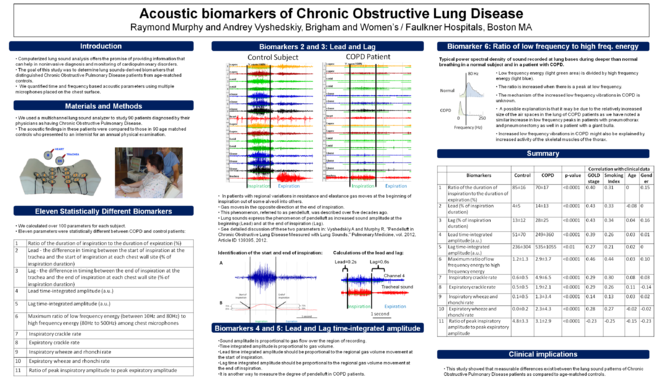
Biomarkers 2 and 3: Lead and Lag
- In patients with regional variations in resistance and elastance gas moves at the beginning of inspiration out of some alveoli into others.
- Gas moves in the opposite direction at the end of inspiration.
- This phenomenon, referred to as pendelluft, was described over five decades ago.
- Lung sounds express the phenomenon of pendelluft as increased sound amplitude at the beginning (Lead) and at the end of inspiration (Lag).
- See detailed discussion of these two parameters in
Vyshedskiy and Murphy (2012)
Biomarkers 4 and 5: Lead and Lag time-integrated amplitude
- Sound amplitude is proportional to gas flow over the region of recording.
- Time integrated amplitude is proportional to gas volume.
- Lead time integrated amplitude should be proportional to the regional gas volume movement at the start of inspiration.
- Lag time integrated amplitude should be proportional to the regional gas volume movement at the end of inspiration.
- It is another way to measure the degree of pendelluft in COPD patients.
Biomarker 6: Ratio of low frequency to high freq. energy
- Low frequency energy (light green area) is divided by high frequency energy (light blue).
- The ratio is increased when there is a peak at low frequency.
- The mechanism of the increased low frequency vibrations in COPD is unknown.
- A possible explanation is that it may be due to the relatively increased size of the air spaces in the lung of COPD patients as we have noted a similar increase in low frequency peaks in patients with pneumothorax and pneumonectomy as well in a patient with a giant bulla.
- Increased low frequency vibrations in COPD might also be explained by increased activity of the skeletal muscles of the thorax.
Results and discussion
Eleven parameters were statistically different between COPD and control patients (
Summary of the Automated Acoustical Data Analysis
|
Correlation with clinical data |
||||||||
|
Biomarkers |
Control |
COPD |
p-value |
GOLD stage |
Smoking Index |
Age |
Gender |
|
|
1 |
Ratio of the duration of inspiration to the duration of expiration (%) |
85±16 |
70±17 |
<0.0001 |
0.40 |
0.31 |
0 |
0.15 |
|
2 |
Lead (% of inspiration duration) |
4±5 |
14±13 |
<0.0001 |
0.43 |
0.33 |
-0.08 |
0 |
|
3 |
Lag (% of inspiration duration) |
13±12 |
28±25 |
<0.0001 |
0.43 |
0.34 |
0.04 |
0.16 |
|
4 |
Lead time-integrated amplitude (a.u.) |
51±70 |
249±360 |
<0.0001 |
0.39 |
0.26 |
0.03 |
0.01 |
|
5 |
Lag time-integrated amplitude (a.u.) |
236±304 |
535±1055 |
<0.01 |
0.27 |
0.21 |
0.02 |
0 |
|
6 |
Maximum ratio of low frequency energy to high frequency energy |
1.2±1.3 |
2.9±3.7 |
<0.0001 |
0.46 |
0.44 |
0.03 |
0.10 |
|
7 |
Inspiratory crackle rate |
0.6±0.5 |
4.9±6.5 |
<0.0001 |
0.29 |
0.30 |
0.08 |
0.03 |
|
8 |
Expiratory crackle rate |
0.5±0.5 |
1.9±2.1 |
<0.0001 |
0.29 |
0.26 |
0.11 |
-0.14 |
|
9 |
Inspiratory wheeze and rhonchi rate |
0.1±0.5 |
1.3±3.4 |
<0.0001 |
0.14 |
0.13 |
0.03 |
0.02 |
|
10 |
Expiratory wheeze and rhonchi rate |
0.0±0.2 |
2.3±4.3 |
<0.0001 |
0.28 |
0.27 |
-0.02 |
-0.02 |
|
11 |
Ratio of peak inspiratory amplitude to peak expiratory amplitude |
4.8±3.3 |
3.1±2.9 |
<0.0001 |
-0.23 |
-0.25 |
-0.15 |
-0.23 |
Conclusions
This study showed that measurable differences exist between the lung sound patterns of Chronic Obstructive Pulmonary Disease patients as compared to age-matched controls.
Presented at
American Thoracic Society, 2012
References
-
Pendelluft in Chronic Obstructive Lung Disease Measured with Lung Sounds.Pulmonary Medicine2012:1‑6. DOI: 10.1155/2012/139395