|
Research Ideas and Outcomes :
Small Grant Proposal
|
|
Corresponding author:
Received: 15 Apr 2016 | Published: 22 Apr 2016
© 2016 Chris Hartgerink, Jelte Wicherts, Marcel van Assen
This is an open access article distributed under the terms of the Creative Commons Attribution License (CC BY 4.0), which permits unrestricted use, distribution, and reproduction in any medium, provided the original author and source are credited.
Citation:
Hartgerink C, Wicherts J, van Assen M (2016) The value of statistical tools to detect data fabrication. Research Ideas and Outcomes 2: e8860. https://doi.org/10.3897/rio.2.e8860
|
|
Abstract
We aim to investigate how statistical tools can help detect potential data fabrication in the social- and medical sciences. In this proposal we outline three projects to assess the value of such statistical tools to detect potential data fabrication and make the first steps in order to apply them automatically to detect data anomalies, potentially due to data fabrication. In Project 1, we examine the performance of statistical methods to detect data fabrication in a mixture of genuine and fabricated data sets, where the fabricated data sets are generated by actual researchers who participate in our study. We also interview these researchers in order to investigate, in Project 2, different data fabrication characteristics and whether data generated with certain characteristics are better detected with current statistical tools than others. In Project 3 we use software to semi-automatically screen research articles to detect data anomalies that are potentially due to fabrication, and develop and test new software forming the basis for automated screening of research articles for data anomalies, potentially due to data fabrication, in the future.
Keywords
data fabrication; statistics; scientific misconduct; integrity
Problem statement
There is a clear need to develop and validate statistical tools to detect (potential) data fabrication in the social- and medical sciences. 2% of researchers admit to have either falsified or fabricated research data once in their professional career (
Considering that data fabrication undermines the epistemological pursuit of science and negatively affects the validity of published findings, fairness in the scientific reward system, and trust in science, it is important to improve its detection. In the last decade, journals have started using automated tools as a screening device to detect image manipulation and plagiarism in submitted or accepted articles. Numerous case studies (e.g., in the Journal of Cell Biology) suggest that these screening tools are effective and useful to detect various forms of research misconduct. In the social- and medical sciences, image detection tools are practically useless because data are primarily quantitative and based on observations of behavior, questionnaires, (cognitive) tests, etc. Despite their potential use as a screening device, there are currently no well-established tools to detect data anomalies (potentially) due to fabrication of quantitative data.
Statistical tools to detect data fabrication have been successful in several ad hoc investigations in the social- and medical sciences, of which the Diederik Stapel case is perhaps the most well known. As in the Fuji case in anesthesiology (
The use of statistical tools is of interest to integrity offices (e.g., ORI), editors, peer-reviewers, or (potential) whistleblowers. Currently, editors and peer-reviewers do not actively look for scientific misconduct whilst reviewing (
Goal(s) and objective(s)
We investigate the performance of statistical tools to detect potential data fabrication in the social- and medical sciences and their potential as an automatic screening tool. To this end, Project 1 aims to evaluate the performance of statistical tools to detect potential data fabrication by inspecting genuine datasets already available and fabricated datasets generated by researchers in our study. In Project 2, we qualitatively assess ways in which researchers fabricate data based on the interviews from Project 1. Finally, in Project 3, we develop and test software to screen research articles for data anomalies potentially due to data fabrication. With these projects, we aim to improve detection methods and lay the groundwork for a thoroughly developed screening tool for detecting data anomalies potentially due to data fabrication.
Project 1: The detection of fabricated raw data
Summary. We invite researchers to fabricate data for a fictional study, which we try to detect as fabricated. We apply the following methods to detect data fabrication: (i) digit analyses, (ii) variance analyses, and (iii) analyses of the multivariate associations. These three types of analyses to detect data fabrication yield 10 tests of data fabrication, which we combine with the Fisher method to provide an overall test of data fabrication. We inspect the performance of these methods with ROC analyses.
This project examines the performance of statistical tools to detect data fabrication. To this end, we subject fictional data to various statistical methods. We examine the performance of such statistical tools using genuine data (already available) and fabricated data we ask researchers to generate. Additionally, we investigate the summary statistics of these data, providing a replication of a study we are currently conducting on validating methods to detect data fabrication with summary statistics.
Digit analysis inspects whether reported values follow expected distributions based on mathematical laws or measurement properties. For instance,
Variance analysis inspects whether there is sufficient variation in the reported standard deviations (SDs; Simonsohn, 2013), something that might be forgotten by data fabricators. Because SDs are subject to sampling fluctuation, there should be variation in those SDs. Based on the study’s sample size and mean SD, the expected amount of sampling fluctuation can be simulated. Subsequently, the observed variation in the SDs can be compared with the expected amount of sampling fluctuation to determine whether the data are overly consistent.
Multivariate associations exist in real data but are often not taken into account by fabricators (e.g.,
Procedure project 1
Of all Dutch/Flemish researchers who published a peer-reviewed paper incorporating the Stroop task (see below), we collect twenty participants for Project 1. We invite these researchers to participate and, if they are willing, schedule a 1.5-hour session where the experimenter (Chris Hartgerink [CHJH] or student-assistant) visits the researcher. In the invitation, researchers are provided with an information leaflet that explains the general procedure and that their participation is compensated with €100. The leaflet includes the informed consent form that explicitly states that the study entails fabricating data for a fictional study and explains our study focuses on the detection of fabricated data with statistical tools. This leaflet also explains that 3 out of 20 fabricated datasets that are the hardest to detect will get an additional reward of €100, which serves as an incentive to fabricate data that are hard to detect.
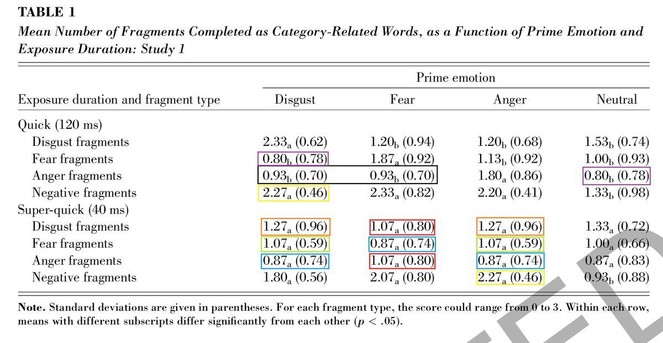
During the session, the instruction explicates the timeframe available for fabrication (i.e., 45 minutes) and specifies the hypotheses in the fictional study for which participating researchers have to fabricate data. We use the
Participants are requested to keep notes on how they fabricate the data for the interview that follows immediately after the participant has completed fabricating data. This interview is semi-structured (audio recorded) and lasts approximately twenty through thirty minutes. They are asked:
- What tool or software did you use during the data fabrication process, if any? (e.g., Excel, SPSS, calculator, etc.)
- Did you apply a specific strategy in fabricating data?
- Did you pay specific attention to how the fabricated data looked in the end?
- Are you familiar with any statistical tools to detect data fabrication?
- Is there anything else you would like to note about how you fabricated the results?
After answering these questions we debrief participants, which includes reminding the participant of ethical standards and professional guidelines that condemn data fabrication, to ensure that the participant realizes this was only an academic exercise.
Evaluation project 1
We use both genuine and fabricated datasets (20 datasets each). We collect the fabricated datasets during the project and we download genuine data from the Many Labs 3 project (osf.io/ct89g;
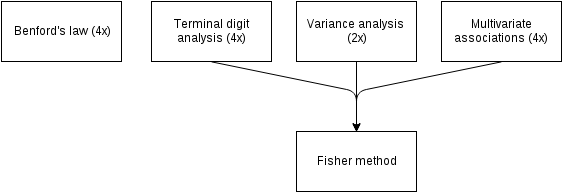
We apply digit analysis to the first and final digit of the fabricated mean and SD response latencies (e.g., for 1.45 we use 1 and 5). We apply Benford’s law to the first digit four times: 2 [congruent/incongruent] × 2 [mean/SD response latencies]. Terminal digit analysis is applied to the last digit four times: 2 [congruent/incongruent] × 2 [mean/SD response latencies]. Each of these applications is based on 25 values (e.g., 25 fabricated means for the congruent condition).
Next, we test whether there is sufficient variance in the 25 fabricated SDs per condition. This results in two variance analyses, one per condition and each based on 25 values. Given that variances of samples from a population with a known population variance are χ2 distributed, with N-1 degrees of freedom, the expected distribution of the variance of the SDs is readily simulated. A p-value is then computed to determine how extreme the observed amount of variation in the SDs is, which serves as a test for potential data fabrication.
We test four multivariate associations between means and SDs of the response latencies by comparing them with the meta-analytic estimate of the genuine data. The multivariate association of means between conditions, SDs between conditions, and the association of means and SDs within conditions are inspected (i.e., four in total). For example, if association between the mean response latencies in the congruent and incongruent conditions is estimated to be distributed normally with μ = .23 and σ = .1 in genuine data, finding an association of -.7 is an extreme value (vice versa: .28 would not be extreme) and can be considered an anomaly.
Finally, we combine the terminal digit analyses, variance analyses, and analyses of multivariate associations into an overall Fisher test (see Fig.
\(\chi^2_{2k}=-2\sum\limits^k_{i=1}ln(p_i)\)
where p is the p-value of the i th method. The p-value of the Fisher test provides an overall indication of evidence for potential data fabrication, based on the three methods and is also used to rank order select those fabricators who receive the bonus, where the three largest p-values receive the bonus.
For all tools the false positive- and false negative rate are investigated and related to sensitivity and specificity, as a function of significance level alpha (varying from .000001 to .1), with data of individual labs and fabricators as unit of analysis. We perform an ROC-analysis and estimate the optimal criterion using cost-benefit analysis of correct and false classifications for the 20 genuine and 20 fabricated data sets included in this project.
Outcomes project 1
-
Twenty publicly available datasets of fabricated raw data on the Stroop effect
-
Manuscript on the performance of statistical tools to detect potentially problematic data
-
Freely available functions to test for potentially problematic data in the R environment
Project 2: Understanding data fabrication
Summary. In Project 2, we investigate how data are fabricated. We document how participants from Project 1 described to have fabricated data. This information is qualitatively analyzed for fabrication characteristics that result in data that are easier or harder to detect as fabricated, in order to better understand which statistical tools can(not) detect certain data fabrication characteristics.
Whereas the previous project focuses on the performance and statistical properties of the tools to detect potential data fabrication, Project 2 focuses on understanding the process of data fabrication. We examine the interviews from Project 1 for data fabrication characteristics and relate these to whether we did (not) detect data fabrication in Project 1.
From Project 1, participants’ data fabrication descriptions (henceforth called participant’s method) are used to answer questions such as: (i) How are participant’s methods linked to tool performance? (ii) Are some tools in Project 1 more successful in predicting the use of some participant’s methods than others? (iii) If some participant’s method lead to undetected data fabrication with existing tools, does this method suggest (further) development of a tool that may be sensitive to this participant’s method?
Procedure project 2
Because the analyses and results of Project 2 are largely dependent on the behavior of participants, we can only provide the framework of our procedure.
Interviews with participants from Project 1 are transcribed, qualitatively analyzed for data fabrication characteristics, and related to the (non-)detection of data fabrication in Project 1. We apply an inductive approach to identify data fabrication characteristics (
Evaluation project 2
We apply crisp set qualitative comparative analysis (QCA;
Example of qualitative comparative analysis. The table indicates three data fabrication characteristics in the columns. Respondents marked * are duplicates; three unique combinations of characteristics are present. Responses that include copy-pasting are detected as fabricated, whereas those that use multivariate simulation were not. Copy-pasting is a sufficient condition to detect data fabrication based on these qualitative data.
|
Copy-paste |
Univariate simulation |
Multivariate simulation |
Detected |
|
| Resp. 1* | 1 | 0 | 0 | Yes |
| Resp. 2 | 0 | 1 | 1 | No |
| Resp. 3 | 1 | 1 | 0 | Yes |
| Resp. 4* | 1 | 0 | 0 | Yes |
Outcomes project 2
-
Collection of transcribed verbal interviews on fabrication characteristics in Project 1
-
Inductive approach to identifying data fabrication characteristics based on interviews
-
Dataset of applied data fabrication characteristics by 20 fabricators, including whether statistical tools from Project 1 were able to detect data fabrication
-
Manuscript on data fabrication characteristics and detection of data fabrication in relation to these characteristics.
Project 3: automated detection of potential data fabrication
Summary. Project 3 applies semi-automatic ways of detecting data anomalies in articles and develops new software that facilitates automated detection of data anomalies. First, we inspect the usefulness of already available software to detect data anomalies (i.e., the R package statcheck) when combined with manual follow-up. Second, we cooperate with ContentMine, specialized in extracting information from research articles in different scientific fields, to improve automated data extraction (e.g., tables, figures). This project provides a proof of concept for using automated procedures to extract data from articles that can be used to detect data anomalies, potentially due to data fabrication. This lays the groundwork for the application of automated procedures in future research (e.g., in Phase II FOA by ORI).
Currently, relatively few articles are inspected for data anomalies; Project 3 investigates and develops methods to increase the number of articles that can be inspected for data anomalies by (semi-)automating this process, greatly decreasing marginal costs for an initial screening. Automated screening tools for data anomalies have been suggested (
This final project investigates screening tools in two subprojects: (i) semi-automatic detection of data anomalies and (ii) development of software to facilitate future automatic detection of data anomalies. In subproject 1 we apply currently available software to semi-automatically detect data anomalies. This software was designed for other purposes than detecting data anomalies and only few statistical methods to detect data anomalies can be applied. Hence, we develop new software in subproject 2 that extracts more data and allows for the application of more extensive statistical methods to detect data anomalies (including the methods from projects 1 and 2).
In subproject 1, we apply available software to screen ~30,000 psychology articles semi-automatically to detect data anomalies. This software, co-developed by the principal investigator CHJH and first released in 2015, is covered more extensively in the procedure section. It automatically extracts statistical results from research articles (e.g., t (85) = 2.86, p = .005) and methods inspecting p-values can subsequently be applied to flag potentially problematic papers. We follow up the flagged articles manually to investigate whether these were indeed anomalous or not (e.g., erroneous data extraction by the software), resulting in a qualitative assessment of what can go wrong in automated data extraction and an initial assessment of how many papers contain anomalies.
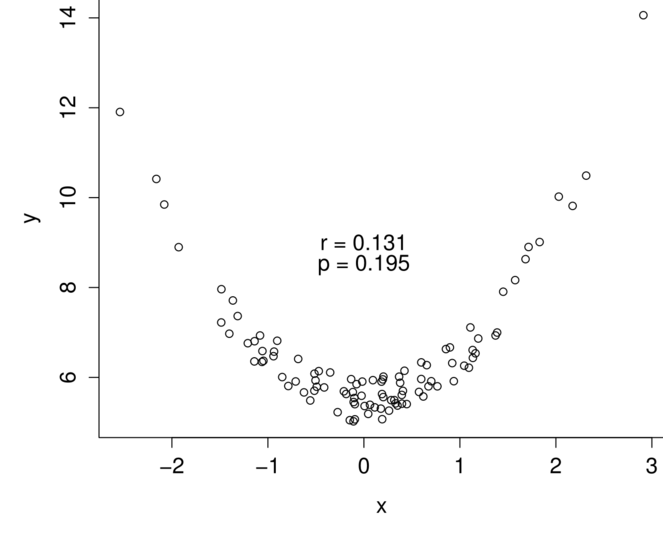
In subproject 2, we team up with ContentMine to create new and more extensive data extraction software. The software from subproject 1 was developed for other purposes than detecting various kinds of data anomalies. Methods from Project 1 and 2 cannot be applied with the available software. In order to extend the data that are extracted and thereby the detection capabilities, we will work together with ContentMine to make software that can extract other information from research articles. Main goals include developing software to extract the raw data underlying scatterplots (e.g., Fig.
After developing this improved open-source software, we validate whether it properly extracts data. Even though subproject 1 provides a proof of concept of using automated tools to detect data anomalies, we need to validate whether these new tools are valid in extracting data prior to applying them to detect data anomalies. As such, the application of this new software to detect data anomalies is scope for future research that becomes possible upon completion of both subproject 1 and 2.
Procedure project 3
Subproject 1 uses semi-automatic procedures to flag psychology articles for data anomalies potentially due to data fabrication. We reuse data extracted from ~30,000 psychology articles with the R package statcheck (osf.io/gdr4q;
Those research articles flagged with the Fisher method as including data anomalies are inspected manually to determine whether there is indeed an anomaly. The statcheck procedure could false-positively flag articles for which it erroneously extracted results, instead of actual problems. This manual investigation allows us to investigate whether they are flagged correctly, and if not, why they were flagged nonetheless. This information can be used to improve data extraction software in subproject 2. When done for all initially flagged research articles this will provide an initial prevalence estimate of how many research articles contain data anomalies out of the ~30,000 inspected.
In subproject 2 of Project 3, ContentMine and we develop software to extract more information from articles. To this end, we use the ContentMine software ami (github.com/contentmine/ami-plugin;
The open-source software developed with ContentMine will be applied to 60 empirical research articles and validated by comparing data extracted manually with data extracted automatically. We manually extract the data the software should extract and check whether the software also does so. In order to ensure cross-publisher applicability of the software, we investigate the validity for five publishers, who publish the majority of the social science literature (Elsevier, Wiley, Taylor Francis, Sage, Springer;
Evaluation project 3
In subproject 1, we flag research articles as potentially problematic based on extracted p-values. To this end, we use the Fisher method and adjust it to investigate whether the p-value distribution is left-skew, instead of the theoretically expected uniform or right-skew distribution. This adjusted Fisher method is computed as
\(\chi^2_{2k}=-2\sum\limits^k_{i=1}ln(1-\frac{p_i-t}{1-t})\)
where t is the lower bound (i.e., threshold) of the k number of p-values taken into account. This method is applied to the p-values available for each article and results in a χ2 value with an accompanying p-value, which tests the null hypothesis that there is no indication for left-skew anomalies in the p-values. For example, if only nonsignificant values are taken into account (i.e., t = .05) and the p- values from one paper are {.99, .8, .01, .03, .87}, there is evidence for a left-skew anomaly in p- values, χ2(6) = 16.20, p = .013. We are currently in the process of validating this method in a study similar to Project 1.
In subproject 2, we validate the newly developed software by manually extracting information from 60 research articles and comparing it to the information extracted automatically. Statistical information that is supposed to be extracted by the software from these 60 research articles will be manually coded (e.g., means, SDs, etc.). Subsequently, we apply the new software to extract information and see to what degree the automatically extracted results correspond to the manually extracted results. With scatterplots, this validation is hardly possible, hence it is feasible that there will be cases where the automated procedures extract more information than the manual data extraction.
Outcomes project 3
-
Dataset on research papers automatically flagged with available software, including whether there was reason to believe it flagged erroneously upon manual inspection.
-
Newly developed open-source software to extract statistical information from empirical research articles (together with ContentMine)
-
Dataset of manually extracted statistical information and automatically extracted statistical information (extracted with new software) for 60 research articles
-
Manuscript on automated detection of data anomalies, potentially due to data fabrication
Responsible conduct of research plan
To ensure the integrity of the proposed research, we cover (i) ethical considerations, (ii) openness of research materials, and (iii) reproducibility of research results. Project 1 is scrutinized by the Tilburg University Psychological Ethical Testing Committee before data collection commences. Second, all research files will be publicly available (data from Project 1 will be permanently anonymized). Third, reproducibility is promoted with dynamic manuscripts (i.e., with the knitr package;
To ensure all personnel is familiar with ethical guidelines, ethical approval, and research protocols, these are (re)distributed and (re)discussed at the start of each research project. Several additional training days for the student-assistant are provided by CHJH, training him/her in essential responsible research skills (e.g., reproducibility, documenting decisions) and provides a theoretical framework for considering ethical issues that are not included in protocols. This ensures that the student-assistant is familiarized with procedures and promotes independence in an open, reproducible fashion.
Dissemination
We disseminate results on Twitter, at conferences, and in Open Access publications. We will spread findings on Twitter; three science related accounts have agreed to disseminate results and reach approximately 50,000 followers (@openscience, 43,000 followers; @onscience, 650 followers; @OSFramework, 4,500 followers). Part of the results of the projects will be presented at the World Conference on Research Integrity 2017 (Amsterdam) and the 2017 Association for Psychological Science (APS) convention in Boston. Manuscripts will be made available upon completion as preprints and submitted to Open Access journals, which results in more downloads per paper and more citations (
Project management
The principal investigator, CHJH, carries day-to-day responsibility for the project (see Table
| What | 9 | 10 | 11 | 12 | 1 | 2 | 3 | 4 | 5 | 6 | 7 | 8 | Lead | |
| Hire research assistant | ✓ | CHJH | ||||||||||||
| Train research assistant | ✓ | ✓ | CHJH | |||||||||||
| Project 1 | Ethical approval | ✓ | CHJH | |||||||||||
| Study setup | ✓ | ✓ | CHJH | |||||||||||
| Invite researchers | ✓ | CHJH | ||||||||||||
| Conduct study | ✓ | ✓ | CHJH | |||||||||||
| Data analysis | ✓ | ✓ | CHJH | |||||||||||
| Write paper | ✓ | ✓ | ✓ | ✓ | ✓ | ✓ | ✓ | ✓ | ✓ | CHJH | ||||
| Programming R package | ✓ | ✓ | ✓ | ✓ | CHJH | |||||||||
| Project 2 | Transcribe interviews | ✓ | CHJH | |||||||||||
| Code interviews | ✓ | ✓ | CHJH | |||||||||||
| Qualitative analysis | ✓ | ✓ | CHJH | |||||||||||
| Write paper | ✓ | ✓ | ✓ | ✓ | ✓ | ✓ | ✓ | ✓ | CHJH | |||||
| Project 3 | Apply Fisher method | ✓ | CHJH | |||||||||||
| Manually check papers flagged by Fisher method | ✓ | ✓ | ✓ | CHJH | ||||||||||
| Develop software to extract statistical information | ✓ | ✓ | ✓ | ✓ | ✓ | Contentmine | ||||||||
| Collect 60 articles | ✓ | CHJH | ||||||||||||
| Automatically extract data from collected articles | ✓ | CHJH | ||||||||||||
| Manually extract data from collected articles | ✓ | ✓ | CHJH | |||||||||||
| Compare manual-automated data | ✓ | CHJH | ||||||||||||
| Write paper | ✓ | ✓ | ✓ | ✓ | ✓ | ✓ | ✓ | ✓ | ✓ | ✓ | ✓ | ✓ | CHJH |
Funding program
This grant proposal has been submitted for the Phase I grant (IR-ORI-16-001) by the Office of Research Integrity. The only addition to the original grant proposal is the reference to Table 2 in the "Project Management" section.
References
- The Law of Anomalous Numbers.Proceedings of the American Philosophical Society78(4):551‑572.
- Do editors and referees look for signs of scientific misconduct when reviewing manuscripts? A quantitative content analysis of studies that examined review criteria and reasons for accepting and rejecting manuscripts for publication.Scientometrics77(3):415‑432. https://doi.org/10.1007/s11192-007-1950-2
- Sensitivity to statistical regularities: People (largely) follow Benford’s law.Proc. Thirty-First Annual Conference of the Cognitive Science Society, Cognitive Science Society,Austin, TX.2872-2877pp.
- The role of biostatistics in the prevention, detection and treatment of fraud in clinical trials.Statistics in Medicine18(24):3435‑3451. https://doi.org/10.1002/(sici)1097-0258(19991230)18:243.0.co;2-o
- The analysis of 168 randomised controlled trials to test data integrity.Anaesthesia67(5):521‑537. https://doi.org/10.1111/j.1365-2044.2012.07128.x
- Calculating the probability of random sampling for continuous variables in submitted or published randomised controlled trials.Anaesthesia70(7):848‑858. https://doi.org/10.1111/anae.13126
- Open access, readership, citations: a randomized controlled trial of scientific journal publishing.The FASEB Journal25(7):2129‑2134. https://doi.org/10.1096/fj.11-183988
- Benford's Law and the Detection of Election Fraud.Political Analysis19(3):245‑268. https://doi.org/10.1093/pan/mpr014
- Not the First Digit! Using Benford's Law to Detect Fraudulent Scientif ic Data.Journal of Applied Statistics34(3):321‑329. https://doi.org/10.1080/02664760601004940
- Many Labs 3: Evaluating participant pool quality across the academic semester via replication.Journal of Experimental Social PsychologyNA:NA.
- How Many Scientists Fabricate and Falsify Research? A Systematic Review and Meta-Analysis of Survey Data.PLoS ONE4(5):e5738. https://doi.org/10.1371/journal.pone.0005738
- Statistical Methods for Research Workers.Oliver and Boyd,Edinburgh, United Kingdom,NApp.
- The Oligopoly of Academic Publishers in the Digital Era.PLOS ONE10(6):e0127502. https://doi.org/10.1371/journal.pone.0127502
- Flawed science: The fraudulent research practices of social psychologist Diederik Stapel. https://www.commissielevelt.nl/
- Probability screening in manuscripts submitted to biomedical journals - an effective tool or a statistical quagmire?Anaesthesia70(7):765‑768. https://doi.org/10.1111/anae.13165
- Uniform occurrence of digits for folded and mixture distributions on finite intervals.Communications in Statistics - Simulation and Computation25(2):481‑506. https://doi.org/10.1080/03610919608813325
- Data fabrication: Can people generate random digits?Accountability in Research4(1):31‑55. https://doi.org/10.1080/08989629508573866
- Terminal Digits and the Examination of Questioned Data.Accountability in Research9(2):75‑92. https://doi.org/10.1080/08989620212969
- AMI-diagram: Mining Facts from Images.D-Lib Magazine20:NA. https://doi.org/10.1045/november14-murray-rust
- The prevalence of statistical reporting errors in psychology (1985–2013).Behavior Research MethodsNA:NA. https://doi.org/10.3758/s13428-015-0664-2
- Configurational comparative methods: Qualitative comparative analysis (QCA) and related techniques.Sage,London: United Kingdom,NApp.
- Emotion Elicitor or Emotion Messenger? Subliminal Priming Reveals Two Faces of Facial Expressions.Psychological Science19(6):593‑600. https://doi.org/10.1111/j.1467-9280.2008.02128.x
- Just Post It: The Lesson From Two Cases of Fabricated Data Detected by Statistics Alone.Psychological Science24(10):1875‑1888. https://doi.org/10.1177/0956797613480366
- Studies of interference in serial verbal reactions.Journal of Experimental Psychology18(6):643‑662. https://doi.org/10.1037/h0054651
- Statistical Reporting Errors and Collaboration on Statistical Analyses in Psychological Science.PLoS ONE9(12):e114876. https://doi.org/10.1371/journal.pone.0114876
- Editor’s Note.Personality and Individual Differences78:100‑101. https://doi.org/10.1016/j.paid.2015.01.024
- Psychology must learn a lesson from fraud case.Nature480(7375):7‑7. https://doi.org/10.1038/480007a
- Dynamic documents with R and knitr.Journal of Statistical Software56:NA.
- A commented review of applications.Configurational Comparative Methods: Qualitative Comparative Analysis (QCA) and related techniques.Sage,London, United Kingdom.