|
Research Ideas and Outcomes : NIH Grant Proposal
|
|
Corresponding author: Arno Klein (arno@binarybottle.com)
Received: 11 Apr 2016 | Published: 19 Apr 2016
© 2016 Arno Klein.
This is an open access article distributed under the terms of the Creative Commons Attribution License (CC BY 4.0), which permits unrestricted use, distribution, and reproduction in any medium, provided the original author and source are credited.
Citation: Klein A (2016) Brain Graph Interface. Research Ideas and Outcomes 2: e8817. doi: 10.3897/rio.2.e8817
|

|
Executive summary
We will analyze variations in brain anatomy and create the first integrated software environment to extract patterns from brains and target differences related to inter-individual variability, pathology, development, or degeneration. We will evaluate how well these differences can help diagnose and predict treatment outcome for major depressive disorder, which affects millions of Americans, but our work is intended to be applied to any mental illness, such as Alzheimer’s disease, bipolar disorder, schizophrenia – indeed to analyze differences in brain anatomy between any two populations.
Keywords
brain imaging, graphical display, interface, interactive GUI
Research & Related Other Project Information
Facilities & Other Resources
Columbia University and Columbia University Medical Center (CUMC) Columbia University was founded in 1754 by the royal grant of George II of England and its purpose was for the instruction of youth in the Learned Languages, and the Liberal Arts and Sciences. A medical faculty was organized in 1767, and was the first institution in the North American Colonies to bestow the degree of Doctor of Medicine. In 1814, Columbia College merged with the College of Physicians and Surgeons, which had obtained an independent charter in 1807. Its use was primarily for servicing the Presbyterian populace. However, it soon began welcoming everyone and became, as noted on a tablet that remains on the hospital today, "For the Poor of New York without Regard to Race, Creed, or Color." An agreement was signed in 1911, between Columbia University the College of Physicians and Surgeons and Presbyterian Hospital. Finally in 1928, the Columbia-Presbyterian Medical Center opened up for operation in the Washington Heights section of Manhattan. Since that time, Columbia University Medical Center has experienced phenomenal growth and development and is now situated on a 20 acre campus and makes up almost half of the close to $2 billion budget of Columbia University. Columbia University Medical Center provides international leadership in basic, pre-clinical, and clinical research, in medical and health sciences education, and in patient care. The medical center trains future leaders and includes the dedicated work of many physicians, scientists, public health professionals, dentists, and nurses at the College of Physicians and Surgeons, the Mailman School of Public Health, the College of Dental Medicine, the School of Nursing, the biomedical departments of the Graduate School of Arts and Sciences, and allied research centers and institutions. Columbia University Medical Center is home to Columbia’s College of Physicians & Surgeons, which is among the most selective medical schools in the country, and the largest medical research enterprise in New York and one of the largest in the United States. It currently boasts some 13 Howard Hughes Medical Institute investigators, 47 members of the Institute of Medicine, 26 members of the American Academy of Arts and Sciences, and 16 Nobel laureates in Medicine or Physiology –- two of which are presently on staff. For more information, please visit www.cumc.columbia.edu.
Environment – Contribution to Success:
Dr. Arno Klein (P.I.) and Dr. Ramin Parsey (Significant Contributor) each work in an office at NYSPI. Dr. Klein’s office opens out into a computer laboratory of fellow researchers and students, with support staff located in neighboring floors. There is office space in this open computer laboratory for the postdoctoral research scientist. Individual computers are able to access centralized services such as NAS (Network Attached Storage) servers, email servers and redundant backup servers and a tape system. These systems are maintained and upgraded by the Information Technology team in collaboration with the institutional networking group. All computers are loaded with a variety of productivity software including statistical, graphics, data and text processing suites. The New York State Psychiatric Institute (NYSPI) Formerly the Pathological Institute, the New York State Psychiatric Institute was founded in 1896 and began its affiliation with the Columbia University College of Physicians & Surgeons in 1925. It has since then grown into a pioneering world-renowned facility for the advancements in mental health research and hygiene. The New York State Psychiatric Institute (NYSPI) has as its mission “the search for knowledge about the causes, prevention, and treatment of mental illness.” It is a vibrant department and is chaired by Dr. Jeffrey Lieberman, an international expert in the area of schizophrenia treatment. Laboratories are located in the north part of the building and space for inpatient care, outpatient clinics, and education is in the south part of the building. Two enclosed bridges connect the new building to the Kolb Annex and the Milstein Hospital Building. In 1985 the Lawrence C. Kolb Research Annex was added to the original facility, which has 50,000 square feet of laboratory space plus the clinical research units described above, office library, and other areas designed for its functioning as a hospital. The Annex also contains the Howard Hughes Institute supporting Nobel Laureate Dr. Eric Kandel and affiliated investigators. This state supported facility is on the campus of the CUMC and has been one of the leading institutions for psychiatric research for over 100 years. Its resources, research faculty and staff, combined with those of the Research Foundation for Mental Hygiene at NYSPI and Columbia University Department of Psychiatry, have made it one of the nation’s foremost psychiatric research centers.
CLINICAL, LABORATORY, AND SUPPORT FACILITIES
The New York State Psychiatric Institute’s newest building was dedicated in May of 1997 and is now known as the Pardes Building. This 6-story building contains approximately 330,000 sq ft of state-ofthe- art laboratory, clinical research and educational facilities, including the inpatient research units and outpatient clinics that are heavily utilized by the fellows and mentors in this program. Trainees also have access to a host of laboratories and clinical facilities at CUMC and NYPH, especially the structural and functional imaging resources in the Department of Radiology, the Irving Center for Clinical Research (GCRC) and the Center for Neurobiology and Behavior, which are all in nearby buildings. Trainees have full access to an excellent library, computer facilities, photocopying, and the animal care facilities in the Kolb Annex building and elsewhere at CUMC. The Department of Psychiatry/Division of Molecular Imaging and Neuropathology (MIND) at Columbia University/NYSPI comprises several components: wet laboratories including biochemistry, neurophysiology, molecular biology, pharmacology, neurohistology and an image analysis facility for quantitative autoradiography and quantitative morphometry. The MIND division has clinical office space for screening, evaluation, and treatment of study participants. We also have a bank of -80°C freezers for storage of samples.
The MIND Computer Center is equipped with several multi-core Apple PowerMac and MacPro workstations running Mac OS X 10.5 and 10.6. The lab is networked via 1000Mbps (gigabit) copper Ethernet and CISCO Catalyst switches. The workstations connect to a Dell Poweredge 6600 computational server with four Intel Xeon MP 2.50GHz CPUs and 24GB of RAM running RedHat Enterprise Linux 3. This server also provides a collection of web applications built using a MySQL database, the lighttpd web server and the Django framework. Printers include a Samsung color laser printer and several high capacity HP black and white printers. The facility also hosts 2 40U cabinets powered with 4 3phase 20Amp circuits to which they are backed up by a generator.
Specific research plan
Specific aims
The largest clinical trial of major depressive disorder (MDD) ever conducted, STAR*D, indicates that two-thirds of patients treated with a first-step antidepressant do not achieve remission of symptoms [
Our hypothesis is that differences in the folding pattern of a brain can provide biomarkers for depression. The difficulty in testing this hypothesis is that there is no established way to rigorously identify or compare the folding patterns across brains in a detailed way, let alone to transition one pattern into another to elucidate differences across brains or across time. And any anatomical differences that could be attributable to depression are masked by the great natural variation that exists across brains. Therefore, to find biomarkers that distinguish endophenotypes of depression, we need to first catalog this natural variation and variation within categories of depressed patients. Then we need to establish a means by which we can compare folding patterns across brains. To this end we propose to introduce automated and robust algorithms for extracting, formally depicting, and quantifying the shapes of folding patterns of the brain in order to target differences related to interindividual variability, pathology, development, or degeneration. We will show that the automated brain feature extraction and anatomical labeling open source software infrastructure that we have built, called
Mindboggle, is uniquely suited to the development of such algorithms. Cataloging variations in the folding pattern of the human brain will permit researchers to situate an individual’s brain pattern within the distribution of possible patterns that characterize healthy conditions and depression. To identify folding pattern biomarkers of depression we will pursue the following goals:
Aim 1: To catalog the most prominent variants of brain folding patterns in healthy and depressed individuals, we will use the Mindboggle software and anatomical database under development by the P.I. to automate extraction and identification of anatomical features such as sulcal fundi from hundreds of MRIs and depict each folding pattern as a graph.
Aim 2: To generate a visual representation of a single or multiple brain graphs (Aim 1) that can be interpreted by a non-neuroscientist or clinician, we will automatically construct an intuitive tree diagram that will enable one to visually pinpoint differences in anatomy across individuals or groups of individuals.
Aim 3: To determine which features of a folding pattern act as diagnostic and predictive biomarkers of MDD, we will visually and quantitatively assess differences (Aim 2) across healthy, remitter, and nonremitter MDD populations.
By enabling researchers to explore and analyze individual and group brain folding patterns, the proposed coherent and comprehensive software interface will aid researchers in their search for biomarkers of depression and other mental disorders.
Research strategy
1 Significance
Depression is a heterogeneous condition whose biological endophenotypes are difficult to categorize and therefore difficult to tailor treatment for. More robust and specific biomarkers of depression that can distinguish these endophenotypes would allow for more effective psychiatric treatment and prediction of treatment outcome. Researchers have recently reported prediction of major depressive disorder (MDD) severity measures from brain grey matter volumes of individual magnetic resonance imaging (MRI) scans [
To our knowledge, however, no one has attempted to clinically diagnose or predict any mental disorder, including depression, based on the folding pattern of the brain, which is thought to be implicated in the pattern of brain wiring and in heritable and developmental constraints. There is recent evidence supporting developmental timing of differential cortical growth [
Our hypothesis is that differences in the folding pattern of a brain can provide biomarkers for depression. This section outlines the primary problems with conventional brain imaging methods for finding biomarkers of mental disorders such as MDD and outlines a new and unique software framework developed by the P.I. that we will use to find brain folding feature-based biomarkers of MDD.
Problems with conventional imaging methods for finding biomarkers of mental disorders
Clinical diagnosis or prediction of treatment outcome for a mental disorder demands that consistent differences be found between a group of individuals with and without the disorder. If these differences are to be detected in brain images, they must be located in corresponding regions across the brains. To establish correspondences across brain images, scientists ubiquitously co-register the images with each other, usually via a template image. However, registering makes three primary assumptions that compromise the search for individual or group differences: 1) Where two images are similar, their anatomical location is the same. However, similar looking portions of two images may represent different anatomical regions. Conversely, two very different images with different underlying anatomy can be forced into alignment such that they appear identical. 2) If two points in one brain correspond to two points in another brain, the intervening points also match. However, there isn’t a one-to-one, let alone continuous mapping of points across any two brains. 3) The template is representative of the group being studied. Because of the great variation across brains and across imaging centers, off-the-shelf templates are suspect, particularly when they are constructed from subjects with different demographics than those of interest to the researcher. Other factors that affect registration quality are often ignored. For example, the P.I. has demonstrated that registration algorithms vary widely in their accuracy [
The challenge of treating Major Depressive Disorder (MDD)
An example of a mental disorder that is in great need of a reliable biomarker is MDD. The largest clinical trial of MDD ever conducted, STAR*D, indicates that two-thirds of patients treated with a first-step antidepressant do not achieve remission of symptoms [
Major Depressive Disorder is the leading cause of disability in the U.S. for ages 15-44 (http://www.who.int/healthinfo/global_burden_disease/GBD_report_2004update_AnnexA.pdf)
Major Depressive Disorder affects approximately 14.8 million American adults, or about 6.7% of the U.S. population age 18 and older (http://www.census.gov/popest/national/asrh/).
Mindboggle features
Our neuromarkers will be derived from an analysis of features extracted with the Mindboggle software (www.mindboggle.info), which automates anatomical labeling of human brain MR data. The original version was created by the P.I. and has been downloaded by users in over 20 countries. Publications describing Mindboggle (PMID: 15627570, 16202176) have been cited 37 times and downloaded many times (the latter has been accessed over 10,000 times from Biomed Central’s website; they state that “overall statistics indicate that your article will have been accessed on PubMed Central a roughly equivalent number of times...”).
The “Mindboggling Shape Analysis and Identification” grant (MH084029-03) which concludes in June of 2012 is currently addressing three needs of the neuroscience community: (a) manually labeled, gold standard brain image data from many individuals, (b) morphometric data to better understand variation of brain structures, and (c) accurate, consistent, and efficient software for automated anatomical labeling of neuroimaging data, in the form of new open source Mindboggle software. A Bayesian framework incorporates the shape information from (b) applied to the labeled brain images from (a) as priors, so that each application of Mindboggle to a new brain image uses these priors in its anatomical feature matching and label assignment (

We are currently extracting the following anatomical features from MRI data using our own algorithms: sulcal pits [
Our features are nested as follows: sulcal pits (points) lie along sulcal fundus curves, which lie along the depths of sulcal basins. Mindboggle stores the nested features as graphs in a Neo4j database that uses a graph-based data model as opposed to a standard relational database (
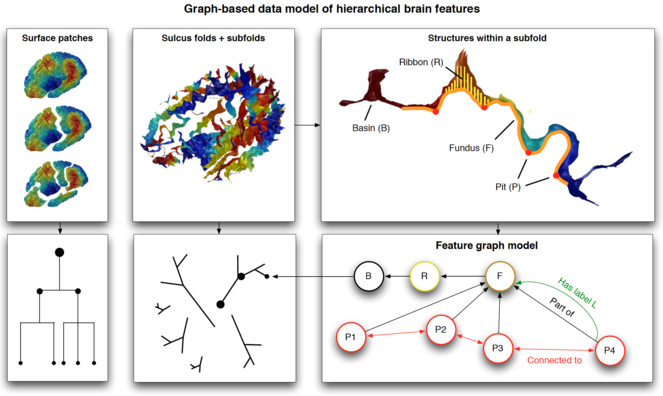
Schematic of Mindboggle’s graph-based database of anatomical features. Top: different structures derived from brain images: surface patches fragmented by application of the Laplace-Beltrami operator, sulcus folds and subfolds, and structures within a subfold. Bottom: schematic graph diagrams representing the relationships among the nested structures. Bottom right: examples of features as properties of edges (relationships such as Part of, Connected to, Has label) and nodes (geometric, shape, and spectral measures).
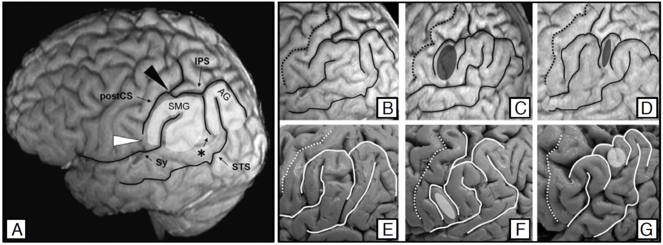
Example of natural morphological variability: left inferior parietal lobule (IPL; figure from [
2 Innovation
• We will introduce a completely new visualization and analysis method for studying individual and group brain anatomy and their variation.
• No one has ever used a network visualization approach to transform one individual’s brain pattern into the pattern of another individual, to the best of our knowledge.
• Our approach focuses on individual variability by matching, quantifiying, and visualizing an individual’s data without resorting to conventional template-based registration methods.
3 Approach
3.1 Specific Aim 1: Catalog variations of nested anatomical features
To catalog the most prominent variants of brain folding patterns in healthy and depressed individuals, we will use the Mindboggle software and anatomical database under development by the P.I. to automate extraction and identification of anatomical features such as sulcal fundi from hundreds of MRIs and depict each folding pattern as a graph.
We will use Mindboggle’s entire database of anatomical features (
— “Biological Predictors of Response to Antidepressants” (MH074813)
— “Biosignature Discovery for Personalized Treatment of Depression” (1U01MH092250-01)
3.2 Specific Aim 2: Tree diagram representation of brain patterns
To generate a visual representation of a single or multiple brain graphs (Aim 1) that can be interpreted by a non-neuroscientist or clinician, we will automatically construct an intuitive tree diagram that will enable one to visually pinpoint differences in anatomy across individuals or groups of individuals.
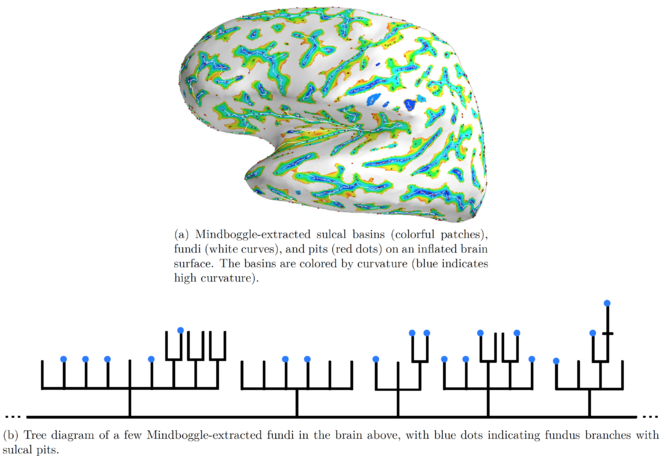
We will represent a given brain’s folding pattern by a hierarchical graph and visually represent this graph as a tree diagram. As a very simple example focusing on the exterior of one region of the brain, in


These three diagrams correspond to the three folding patterns in
b: Folding pattern 2.
c: Folding pattern 3.
3.3 Specific Aim 3: Application to major depressive disorder data
To determine which features of a folding pattern act as diagnostic and predictive biomarkers of MDD, we will visually and quantitatively assess differences (Aim 2) across healthy, remitter, and nonremitter MDD populations.
For this aim we will combine the different tree diagrams generated from all of the brain data in the Mindboggle anatomical database (
Project
We will analyze variations in brain anatomy and create the first integrated software environment to extract patterns from brains and target differences related to inter-individual variability, pathology, development, or degeneration. We will evaluate how well these differences can help diagnose and predict treatment outcome for major depressive disorder (MDD), which affects millions of Americans, but our work is intended to be applied to any mental illness, such as Alzheimer’s disease, bipolar disorder, schizophrenia – indeed to analyze differences in brain anatomy between any two populations. The specific aims of this proposal are as follows:
Aim 1: To catalog the most prominent variants of brain folding patterns in healthy and depressed individuals, we will use the Mindboggle software and anatomical database under development by the P.I. to automate extraction and identification of anatomical features such as sulcal fundi from hundreds of MRIs and depict each folding pattern as a graph.
Aim 2: To generate a visual representation of a single or multiple brain graphs that can be interpreted by a non-neuroscientist or clinician, we will automatically construct an intuitive tree diagram that will enable one to visually pinpoint differences in anatomy across individuals or groups of individuals.
Aim 3: To determine which features of a folding pattern act as diagnostic and predictive biomarkers of MDD, we will visually and quantitatively assess differences across healthy, remitter, and nonremitter MDD populations.
By enabling researchers to explore and analyze brain variation across individuals in a coherent and comprehensive software interface, we will enhance our understanding of brain variation and change and enrich our characterization of individual brain patterns, or “neural signatures.” These signatures are intended to provide the biomarkers sought in our pursuit of personalized medicine.
Call
NIH PAR-09-219: Exploratory Innovations in Biomedical Computational Science and Technology (R21)
Hosting institution
Columbia University
Ethics and security
Protection of Human Subjects
This research is exempt by Exception 4.
All data to be analyzed in this proposal have already been acquired, and for the most part are freely and publicly available for distribution and data analysis (OASIS brain image repository). Data will be stripped of all identifying information before they are sent to the investigators. Data were acquired from a wide range of subjects representing broad demographics with respect to age, gender, race, etc. (including minorities). The OASIS dataset consists of a cross-sectional collection of 416 subjects covering the adult life span aged 18 to 96 including individuals with early-stage Alzheimer’s Disease (AD).
Author contributions
AK conceived of and wrote this proposal.
Conflicts of interest
None
References
-
Genetic variability of human brain size and cortical gyral patterns.Brain120(2):257‑269. DOI: 10.1093/brain/120.2.257
-
Cortical folding abnormalities in schizophrenia patients with resistant auditory hallucinations.NeuroImage39(3):927‑935. DOI: 10.1016/j.neuroimage.2007.08.049
-
Mapping the Early Cortical Folding Process in the Preterm Newborn Brain.Cerebral Cortex18(6):1444‑1454. DOI: 10.1093/cercor/bhm180
-
Primary cortical folding in the human newborn: an early marker of later functional development.Brain131(8):2028‑2041. DOI: 10.1093/brain/awn137
-
Epilepsy and genetic malformations of the cerebral cortex.American Journal of Medical Genetics106(2):160‑173. DOI: 10.1002/ajmg.1569
-
Abnormal development of the human cerebral cortex: genetics, functional consequences and treatment options.Trends in Neurosciences31(3):154‑162. DOI: 10.1016/j.tins.2007.12.004
-
Abnormal cortical folding in high-risk individuals: a predictor of the development of schizophrenia?Biological Psychiatry56(3):182‑189. DOI: 10.1016/j.biopsych.2004.04.007
-
Antidepressants and hypothalamic-pituitary-adrenocortical regulation.Endocrine Reviews17(2):187‑205. DOI: 10.1210/er.17.2.187
-
Spatial Distribution of Deep Sulcal Landmarks and Hemispherical Asymmetry on the Cortical Surface.Cerebral Cortex20(3):602‑611. DOI: 10.1093/cercor/bhp127
-
Quantification and Discrimination of Abnormal Sulcal Patterns in Polymicrogyria.Cerebral Cortex23(12):3007‑3015. DOI: 10.1093/cercor/bhs292
-
Quantitative comparison and analysis of sulcal patterns using sulcal graph matching: A twin study.NeuroImage57(3):1077‑1086. DOI: 10.1016/j.neuroimage.2011.04.062
-
Topological morphing using Reeb graphs.Proceedings of the First International Symposium on Cyber Worlds3.2:465‑471.
-
A Geometric Method for Automatic Extraction of Sulcal Fundi.IEEE Transactions on Medical Imaging26(4):530‑540. DOI: 10.1109/tmi.2006.886810
-
Topographic Analysis of the Inferior Parietal Lobule in High-Resolution 3D MR Imaging.American Journal of Neuroradiology30(3):520‑524. DOI: 10.3174/ajnr.a1417
-
Evaluation of 14 nonlinear deformation algorithms applied to human brain MRI registration.NeuroImage46(3):786‑802. DOI: 10.1016/j.neuroimage.2008.12.037
-
A Novel Method for Cortical Sulcal Fundi Extraction.Lecture Notes in Computer Science. URL: https://doi.org/10.1007/978-3-540-85988-8_33 DOI: 10.1007/978-3-540-85988-8_33
-
Automatic labelling of the human cortical surface using sulcal basins.Medical Image Analysis4(3):179‑188. DOI: 10.1016/s1361-8415(00)00024-4
-
Deep Sulcal Landmarks Provide an Organizing Framework for Human Cortical Folding.Cerebral Cortex18(6):1415‑1420. DOI: 10.1093/cercor/bhm174
-
In-vivo measurement of cortical morphology: means and meanings.Current Opinion in Neurology23(4):1. DOI: 10.1097/wco.0b013e32833a0afc
-
Prediction of illness severity in patients with major depression using structural MR brain scans.Journal of Magnetic Resonance Imaging35(1):64‑71. DOI: 10.1002/jmri.22806
-
Cortical folding difference between patients with early-onset and patients with intermediate-onset bipolar disorder.Bipolar Disorders11(4):361‑370. DOI: 10.1111/j.1399-5618.2009.00683.x
-
Automated Sulcal Segmentation Using Watersheds on the Cortical Surface.NeuroImage15(2):329‑344. DOI: 10.1006/nimg.2001.0975
-
Laplace–Beltrami eigenvalues and topological features of eigenfunctions for statistical shape analysis.Computer-Aided Design41(10):739‑755. DOI: 10.1016/j.cad.2009.02.007
-
On the genetic architecture of cortical folding and brain volume in primates.NeuroImage53(3):1103‑1108. DOI: 10.1016/j.neuroimage.2010.02.020
-
Reduced Cortical Folding in Schizophrenia: An MRI Morphometric Study.American Journal of Psychiatry160(9):1606‑1613. DOI: 10.1176/appi.ajp.160.9.1606
-
Developmental genetic malformations of the cerebral cortex.Current Neurology and Neuroscience Reports3(5):433‑441. DOI: 10.1007/s11910-003-0027-8
-
Increased Right Prefrontal Cortical Folding in Adolescents at Risk of Schizophrenia for Cognitive Reasons.Biological Psychiatry63(1):80‑85. DOI: 10.1016/j.biopsych.2007.04.012
-
Evaluation of Outcomes With Citalopram for Depression Using Measurement-Based Care in STAR*D: Implications for Clinical Practice.American Journal of Psychiatry163(1):28‑40. DOI: 10.1176/appi.ajp.163.1.28
-
Symmetry of Cortical Folding Abnormalities in Williams Syndrome Revealed by Surface-Based Analyses.Journal of Neuroscience26(20):5470‑5483. DOI: 10.1523/jneurosci.4154-05.2006
-
Axons Pull on the Brain, But Tension Does Not Drive Cortical Folding.Journal of Biomechanical Engineering132(7):071013. DOI: 10.1115/1.4001683